 4
4peptides
spectra
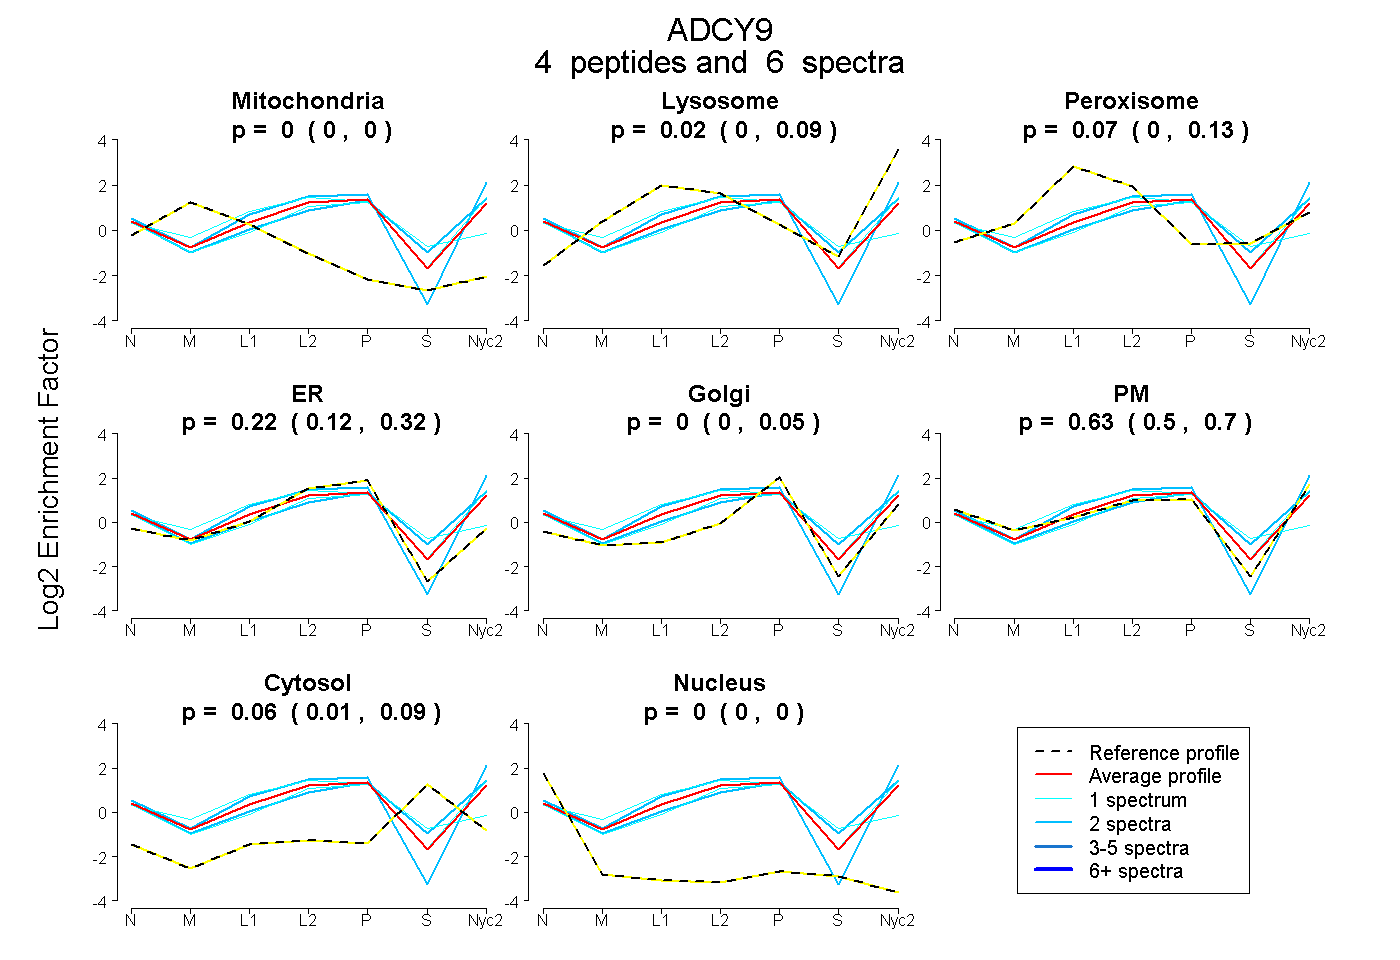
0.000 | 0.000
0.000 | 0.089
0.000 | 0.130
0.121 | 0.321
0.000 | 0.051
0.503 | 0.701
0.011 | 0.092
0.000 | 0.000
| Plot | Mito | Lyso | Perox | ER | Golgi | PM | Cytosol | Nucleus | |||||
| Expt A |
4 peptides |
6 spectra |
|
0.000 0.000 | 0.000 |
0.022 0.000 | 0.089 |
0.067 0.000 | 0.130 |
0.223 0.121 | 0.321 |
0.000 0.000 | 0.051 |
0.631 0.503 | 0.701 |
0.056 0.011 | 0.092 |
0.000 0.000 | 0.000 |
| 1 spectrum, VGVHTGTVLCGILGMR | 0.000 | 0.000 | 0.089 | 0.515 | 0.000 | 0.156 | 0.239 | 0.000 | ||
| 2 spectra, APIAFRPFK | 0.000 | 0.033 | 0.000 | 0.053 | 0.000 | 0.914 | 0.000 | 0.000 | ||
| 1 spectrum, MIHSVMPR | 0.000 | 0.083 | 0.165 | 0.171 | 0.000 | 0.580 | 0.000 | 0.000 | ||
| 2 spectra, LPQLFER | 0.000 | 0.074 | 0.000 | 0.056 | 0.044 | 0.659 | 0.167 | 0.000 |
| Plot | Lyso | Other | |||||||||||
| Expt C |
1 peptide |
4 spectra |
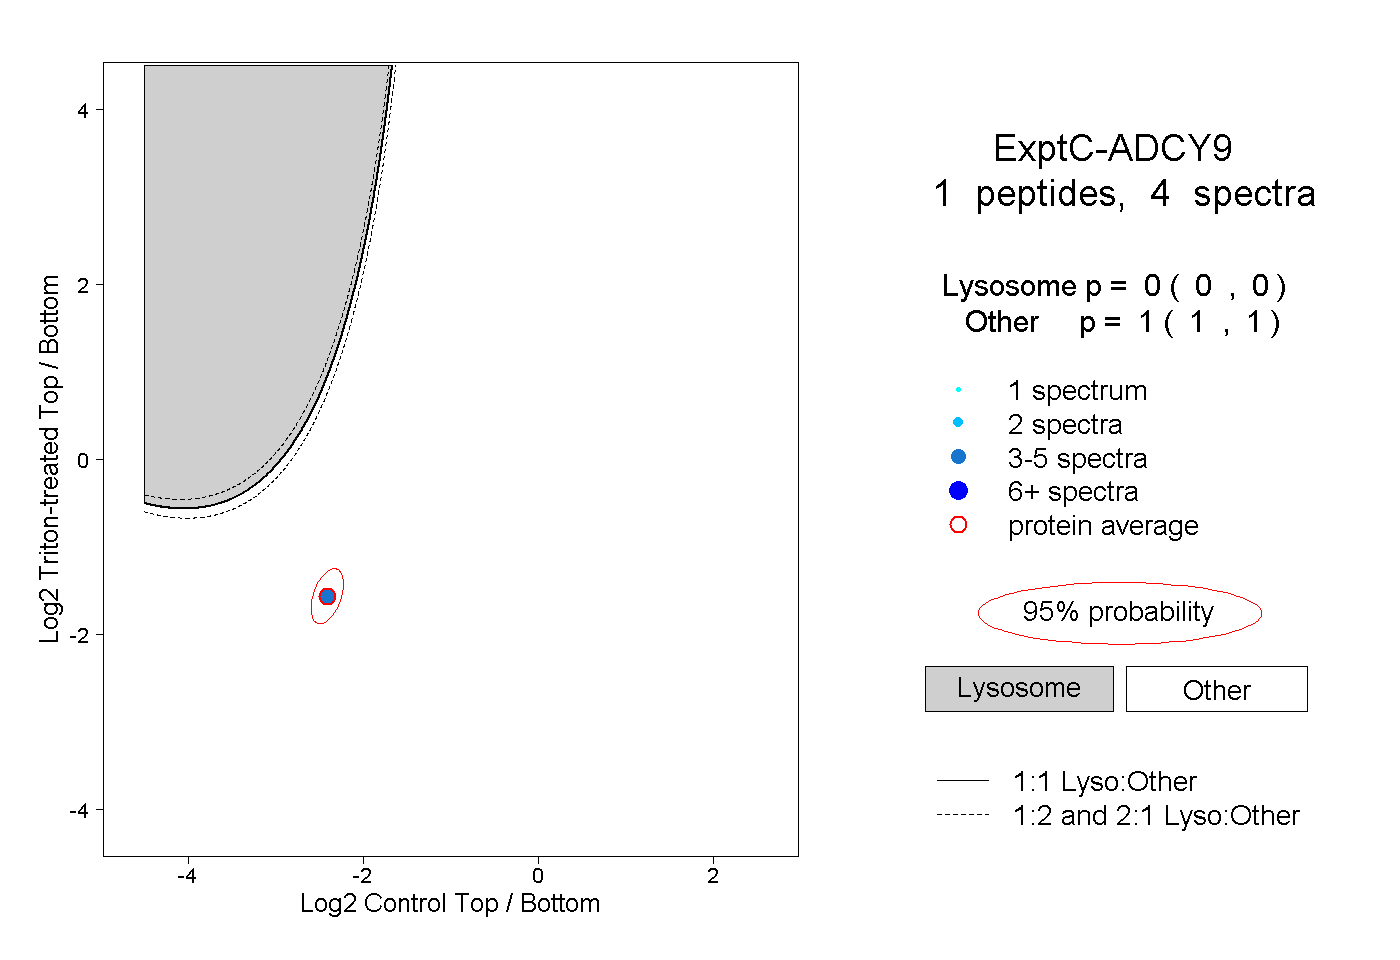 |
0.000 0.000 | 0.000 |
1.000 1.000 | 1.000 |