 2
2peptides
spectra
0.000 | 0.000
0.000 | 0.000
0.000 | 0.021
0.177 | 0.423
0.000 | 0.147
0.000 | 0.000
0.555 | 0.651
0.000 | 0.000
1peptide
spectrum
NA | NA
NA | NA
| Plot | Mito | Lyso | Perox | ER | Golgi | PM | Cytosol | Nucleus | |||||
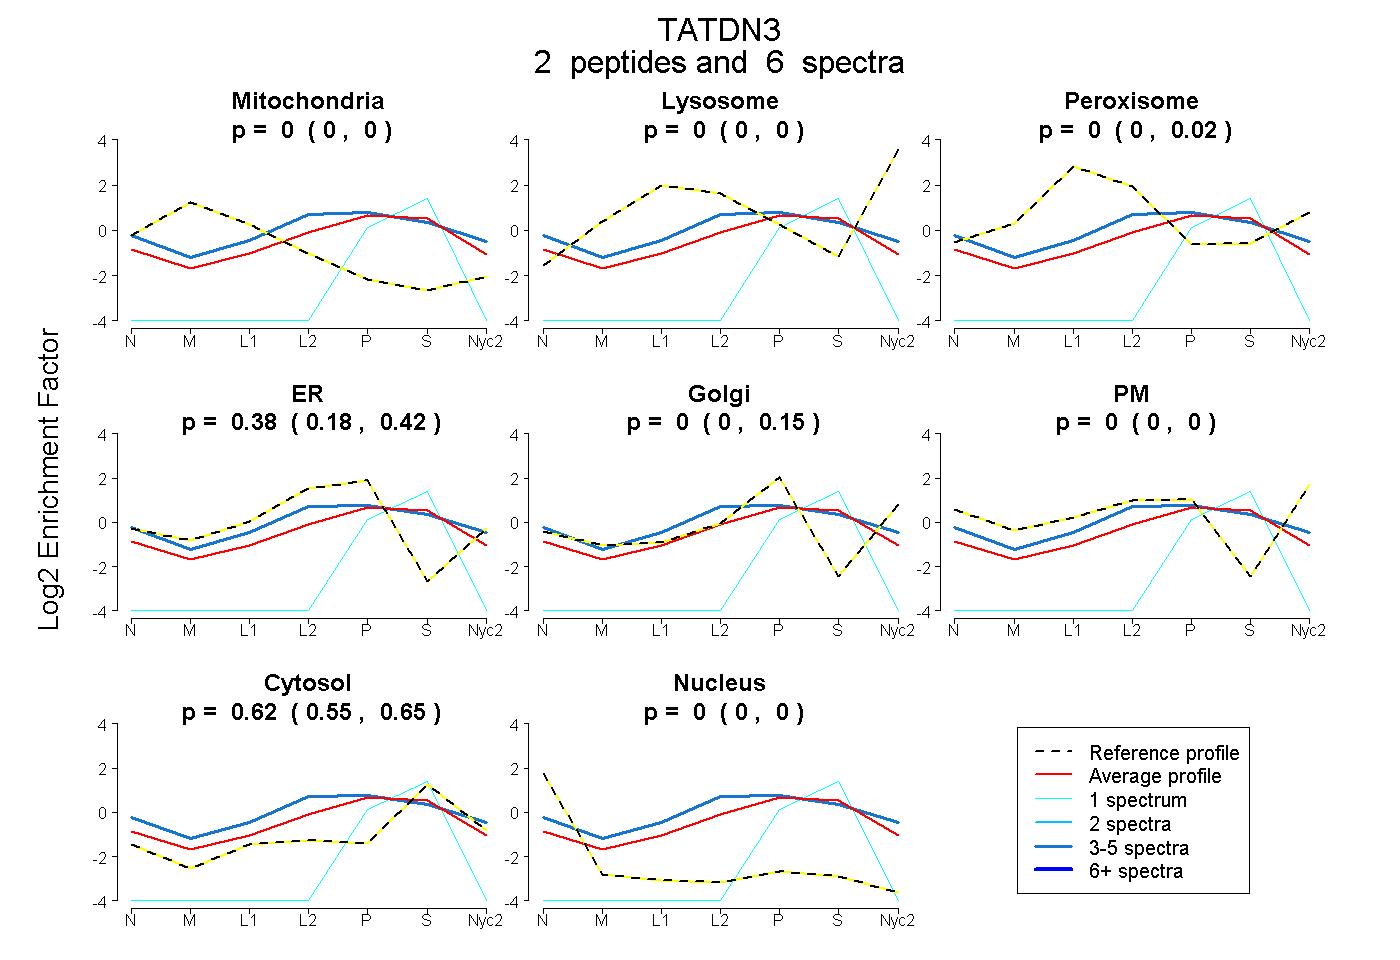
| Expt A |
2 peptides |
6 spectra |
|
0.000 0.000 | 0.000 |
0.000 0.000 | 0.000 |
0.000 0.000 | 0.021 |
0.382 0.177 | 0.423 |
0.000 0.000 | 0.147 |
0.000 0.000 | 0.000 |
0.618 0.555 | 0.651 |
0.000 0.000 | 0.000 |
||
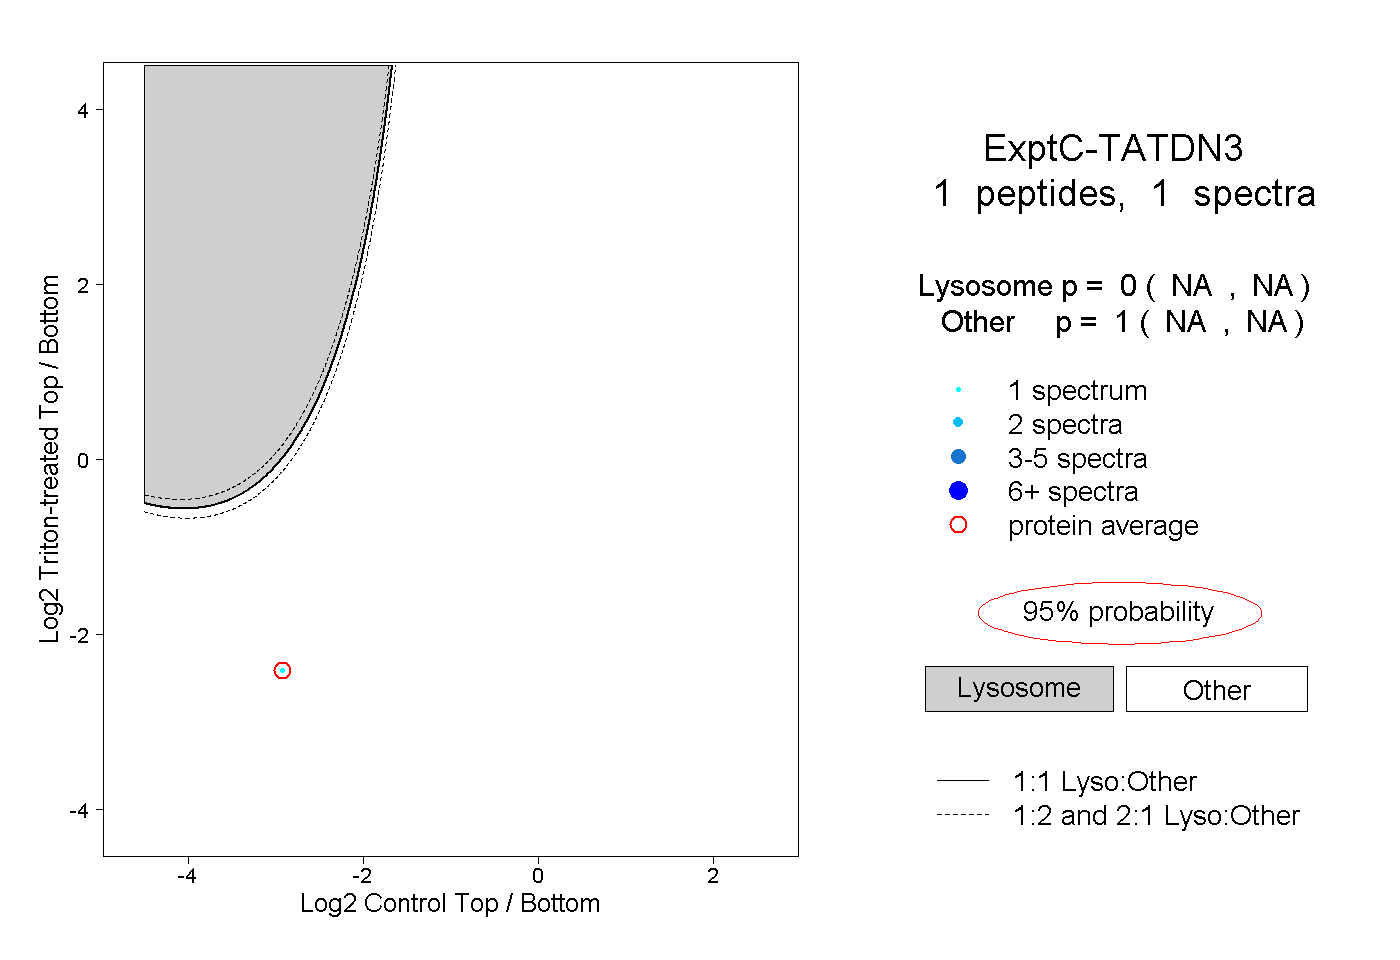
| Plot | Lyso | Other | |||||||||||
| Expt C |
1 peptide |
1 spectrum |
|
0.000 NA | NA |
1.000 NA | NA |