 8
8peptides
spectra
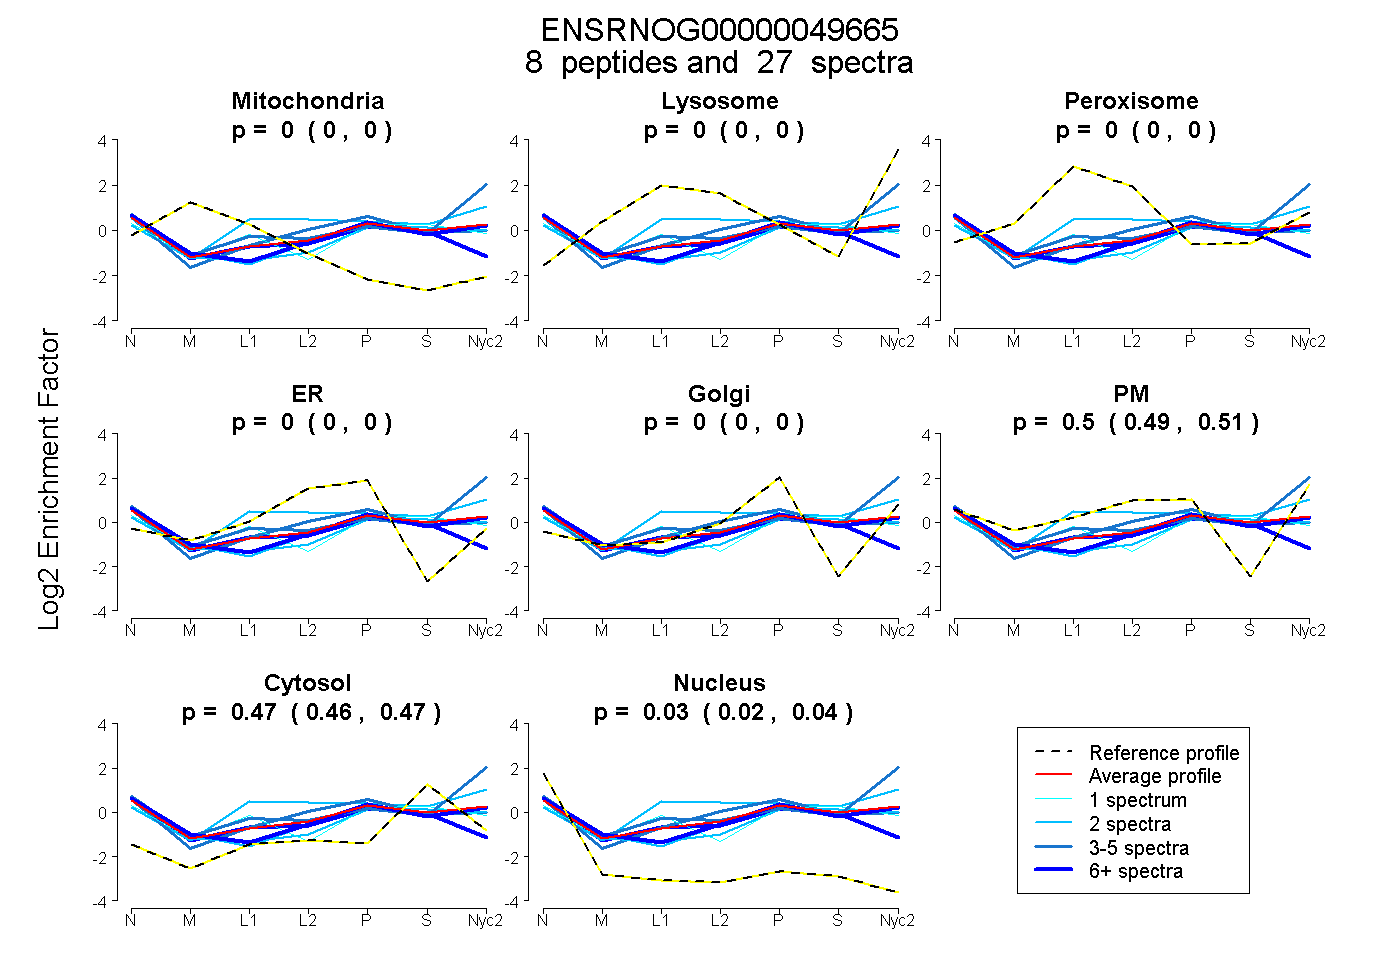
0.000 | 0.000
0.000 | 0.000
0.000 | 0.000
0.000 | 0.000
0.000 | 0.000
0.493 | 0.512
0.462 | 0.472
0.018 | 0.038
6peptides
spectra
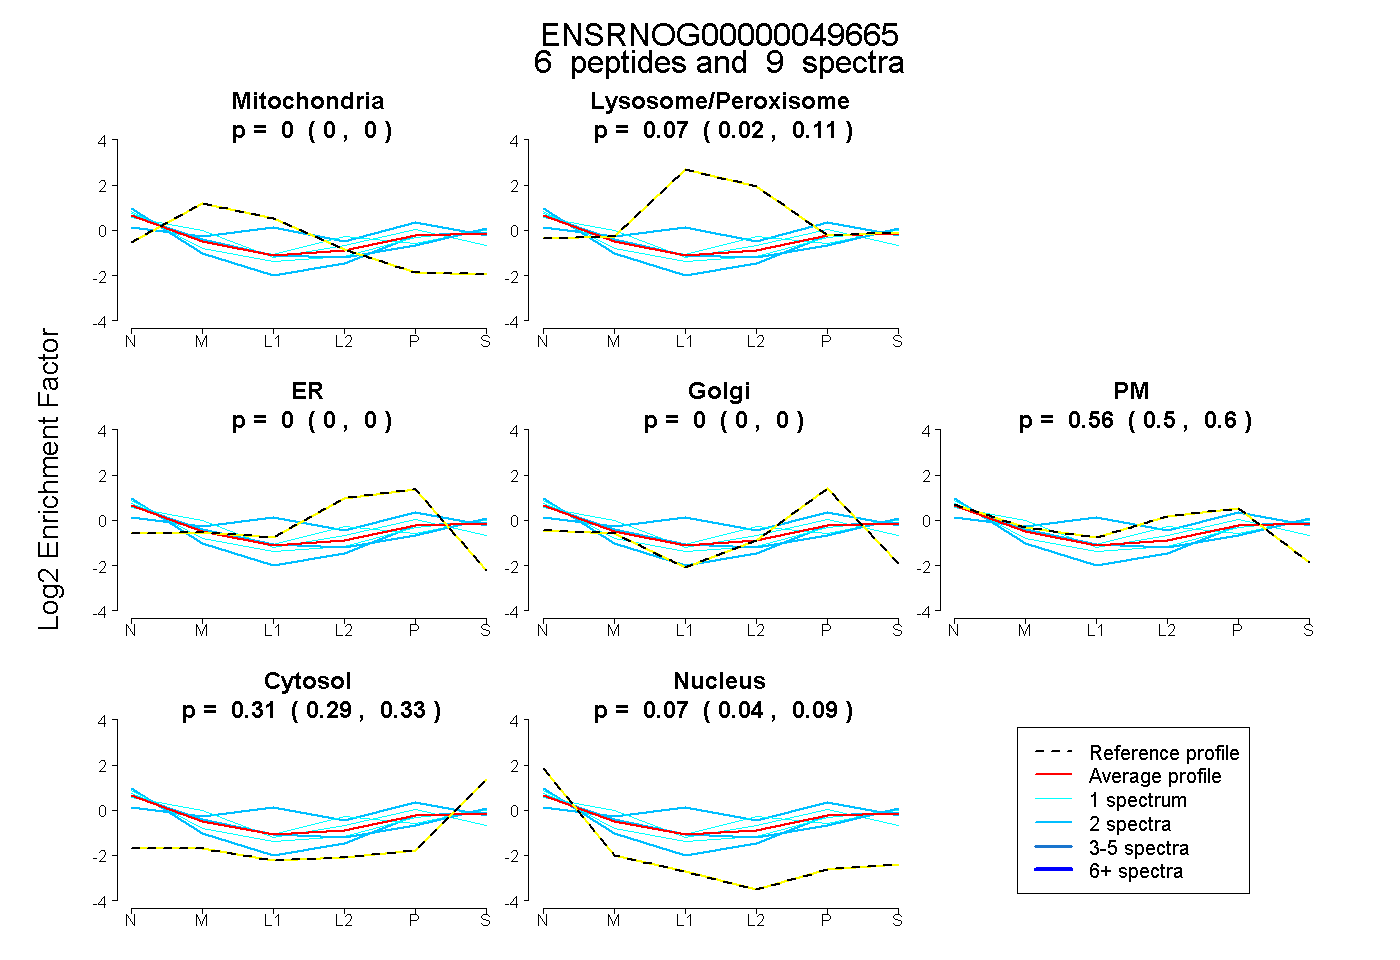
0.000 | 0.000
0.017 | 0.108
0.000 | 0.000
0.000 | 0.000
0.501 | 0.604
0.285 | 0.331
0.036 | 0.093
5peptides
spectra
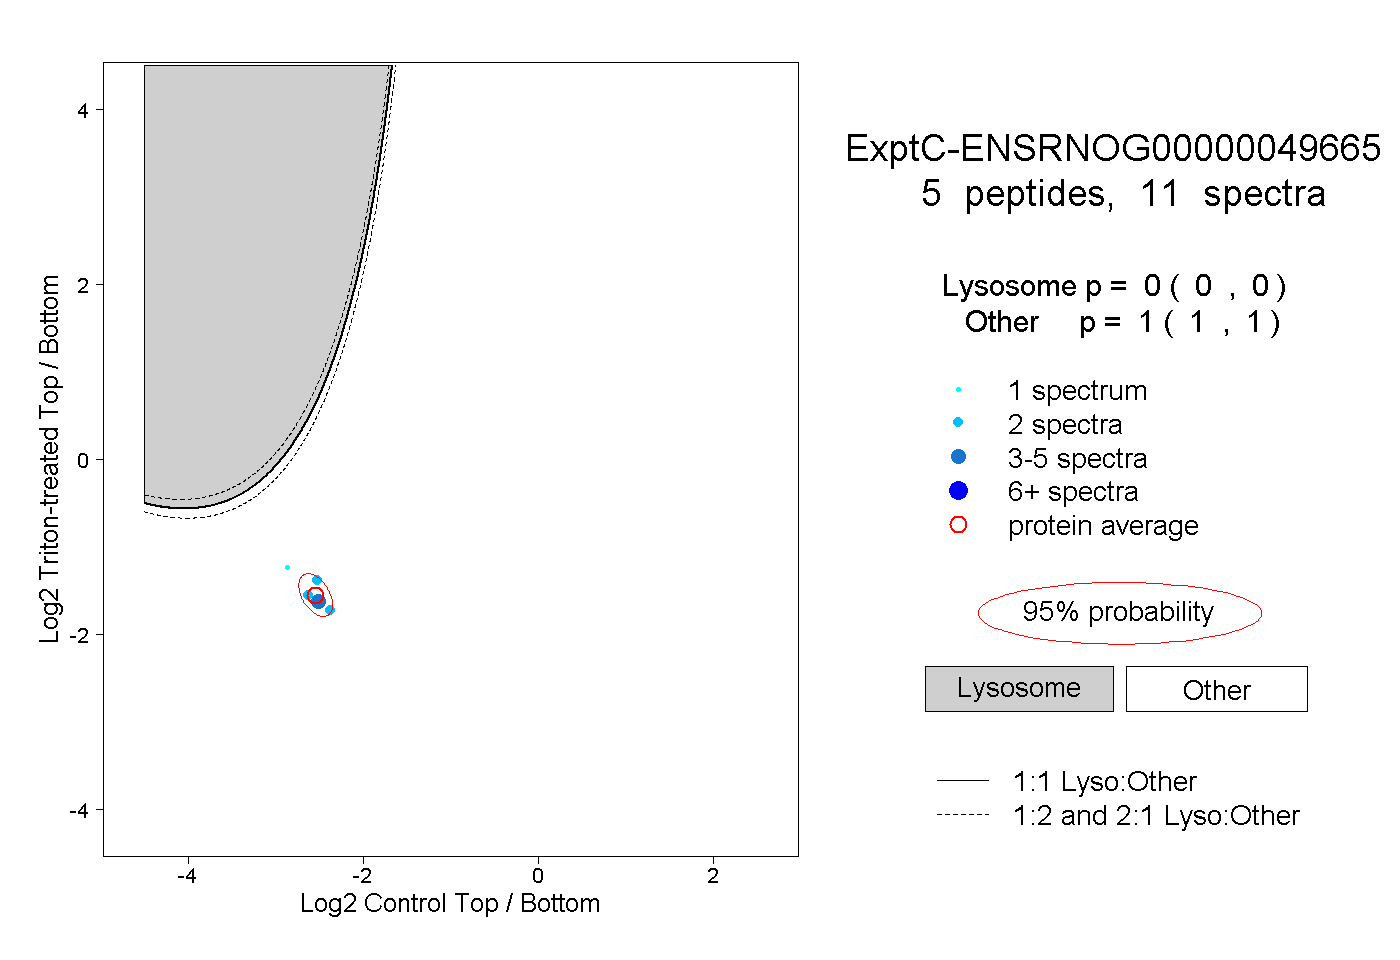
0.000 | 0.000
1.000 | 1.000
2peptides
spectra
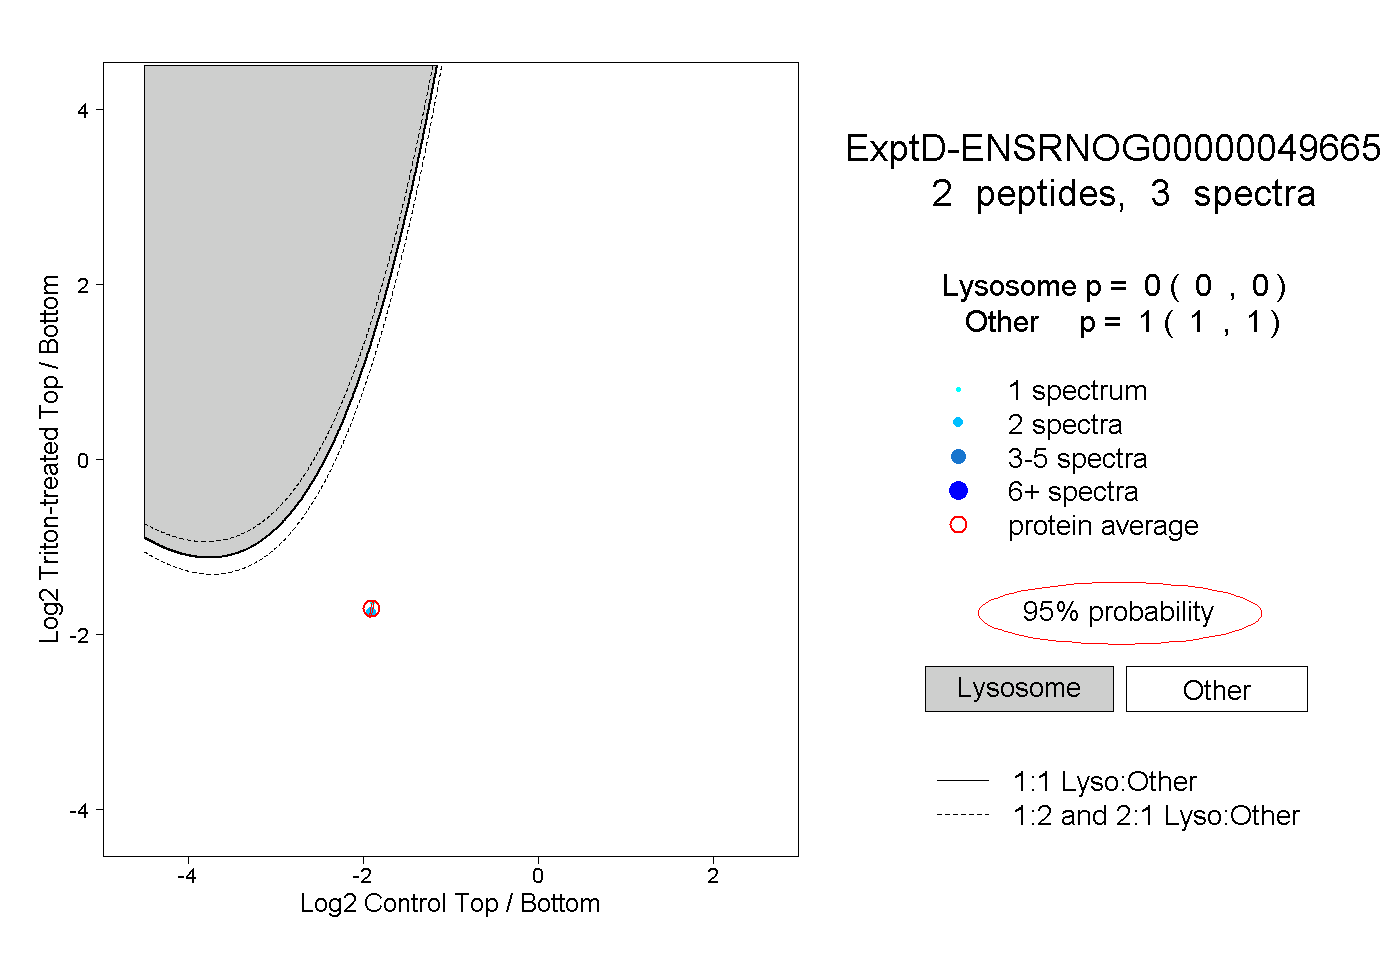
0.000 | 0.000
1.000 | 1.000