 5
5peptides
spectra
0.000 | 0.000
0.000 | 0.000
0.000 | 0.000
0.000 | 0.000
0.000 | 0.000
0.000 | 0.000
0.209 | 0.255
0.742 | 0.787
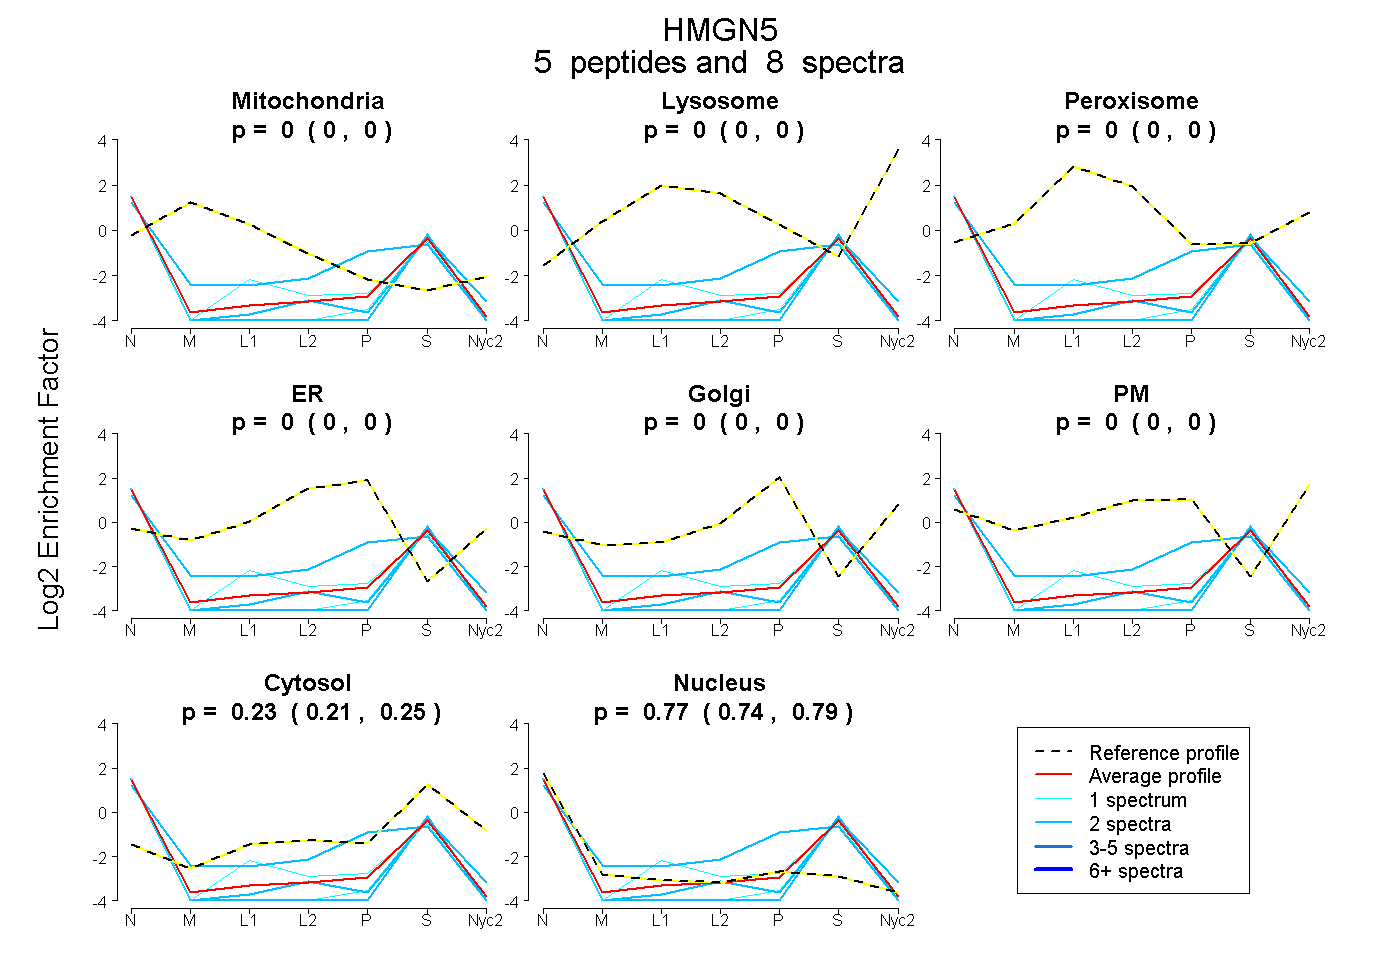
| Plot | Mito | Lyso | Perox | ER | Golgi | PM | Cytosol | Nucleus | |||||
| Expt A |
5 peptides |
8 spectra |
|
0.000 0.000 | 0.000 |
0.000 0.000 | 0.000 |
0.000 0.000 | 0.000 |
0.000 0.000 | 0.000 |
0.000 0.000 | 0.000 |
0.000 0.000 | 0.000 |
0.234 0.209 | 0.255 |
0.766 0.742 | 0.787 |
| 2 spectra, GECNMENAENGEAK | 0.000 | 0.000 | 0.000 | 0.000 | 0.000 | 0.000 | 0.141 | 0.859 | ||
| 2 spectra, TTNVVEESK | 0.000 | 0.000 | 0.000 | 0.067 | 0.000 | 0.000 | 0.299 | 0.633 | ||
| 1 spectrum, AAGDASQEPK | 0.000 | 0.000 | 0.000 | 0.000 | 0.000 | 0.000 | 0.149 | 0.851 | ||
| 1 spectrum, LSAMPVPFTPELKPK | 0.000 | 0.000 | 0.000 | 0.000 | 0.000 | 0.000 | 0.258 | 0.742 | ||
| 2 spectra, IIEAPISK | 0.000 | 0.000 | 0.000 | 0.000 | 0.000 | 0.000 | 0.238 | 0.762 |