 2
2peptides
spectra
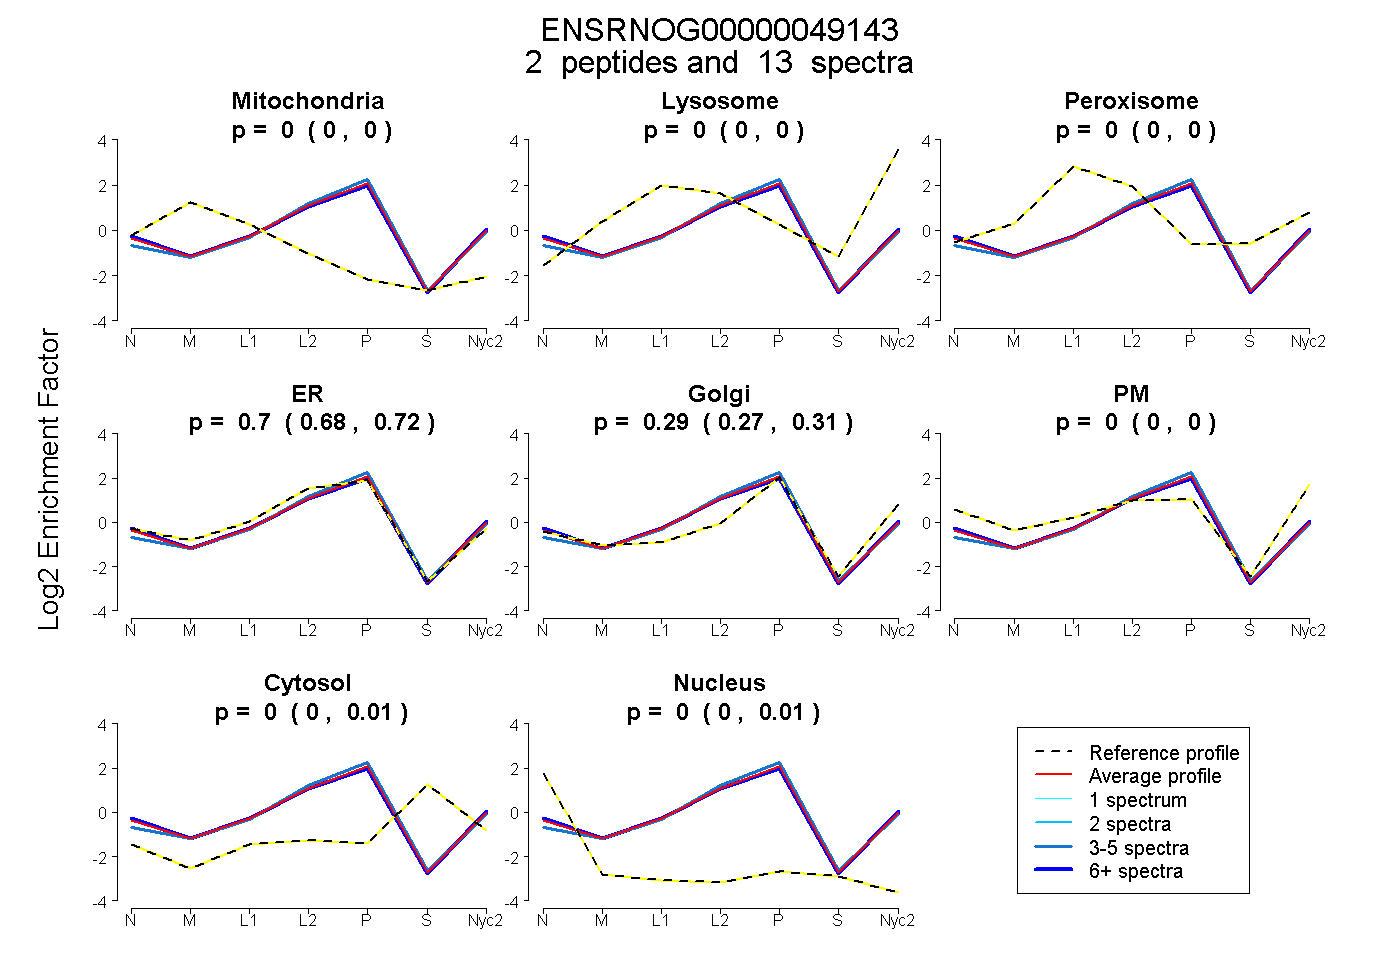
0.000 | 0.000
0.000 | 0.000
0.000 | 0.000
0.682 | 0.717
0.271 | 0.312
0.000 | 0.000
0.000 | 0.010
0.000 | 0.010
2peptides
spectra
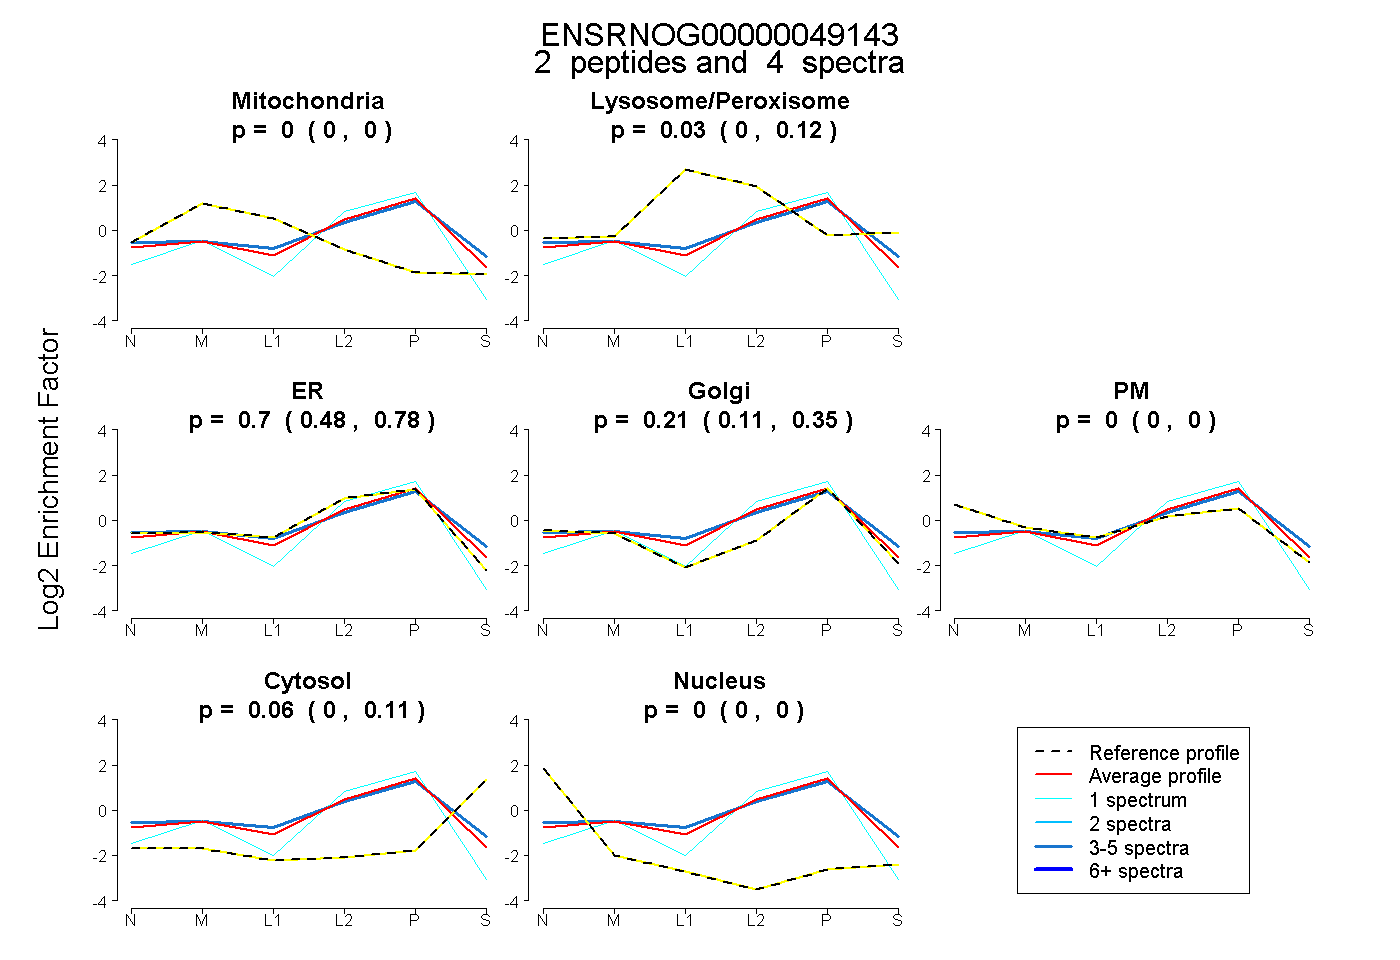
0.000 | 0.000
0.000 | 0.117
0.476 | 0.784
0.110 | 0.347
0.000 | 0.000
0.000 | 0.109
0.000 | 0.000
2peptides
spectra
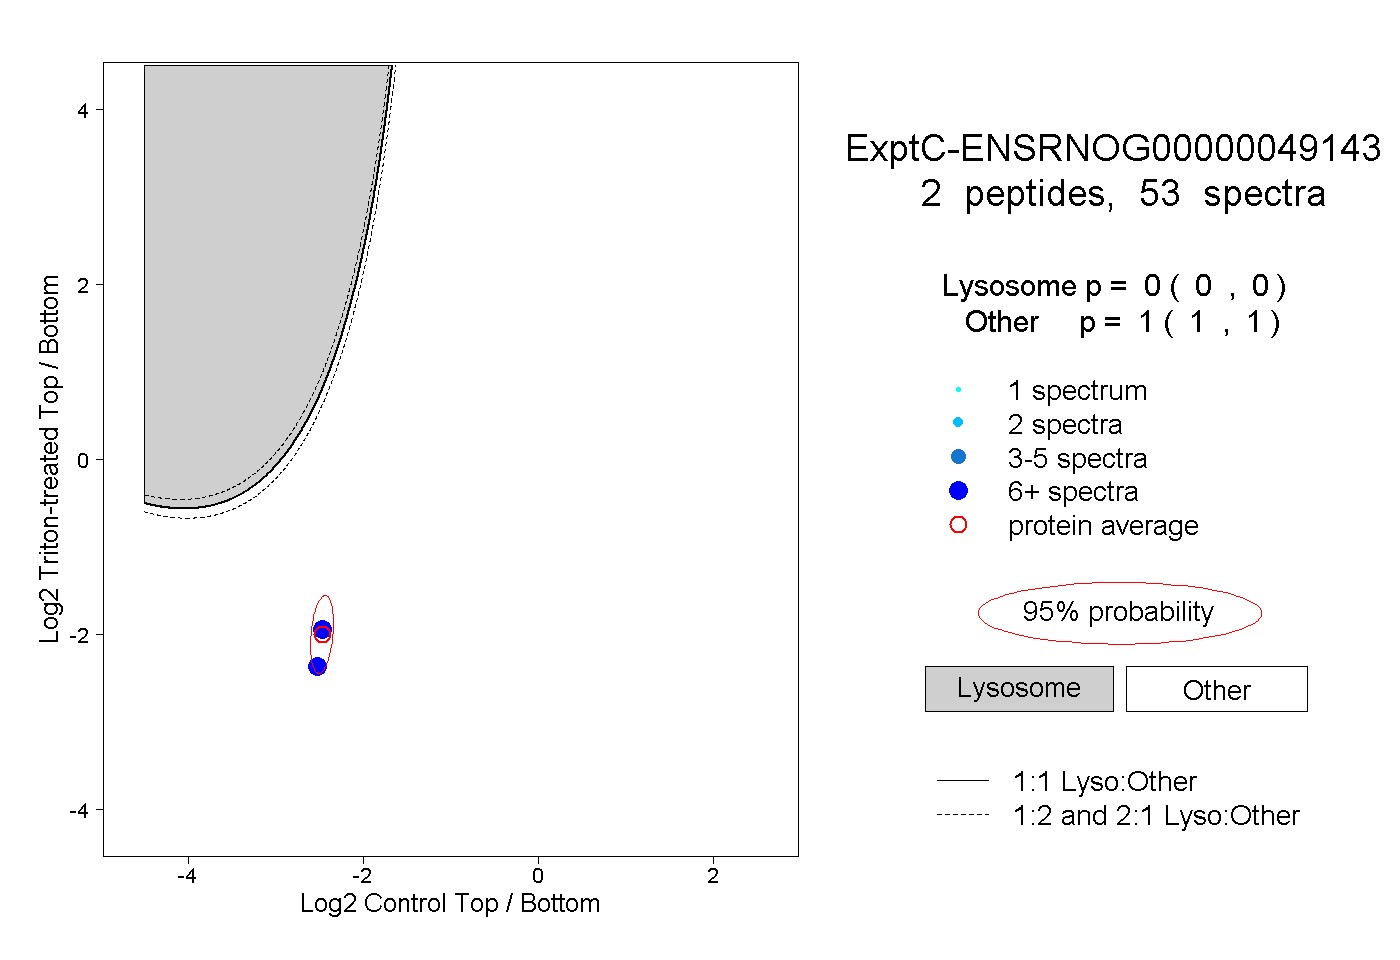
0.000 | 0.000
1.000 | 1.000
1peptide
spectra
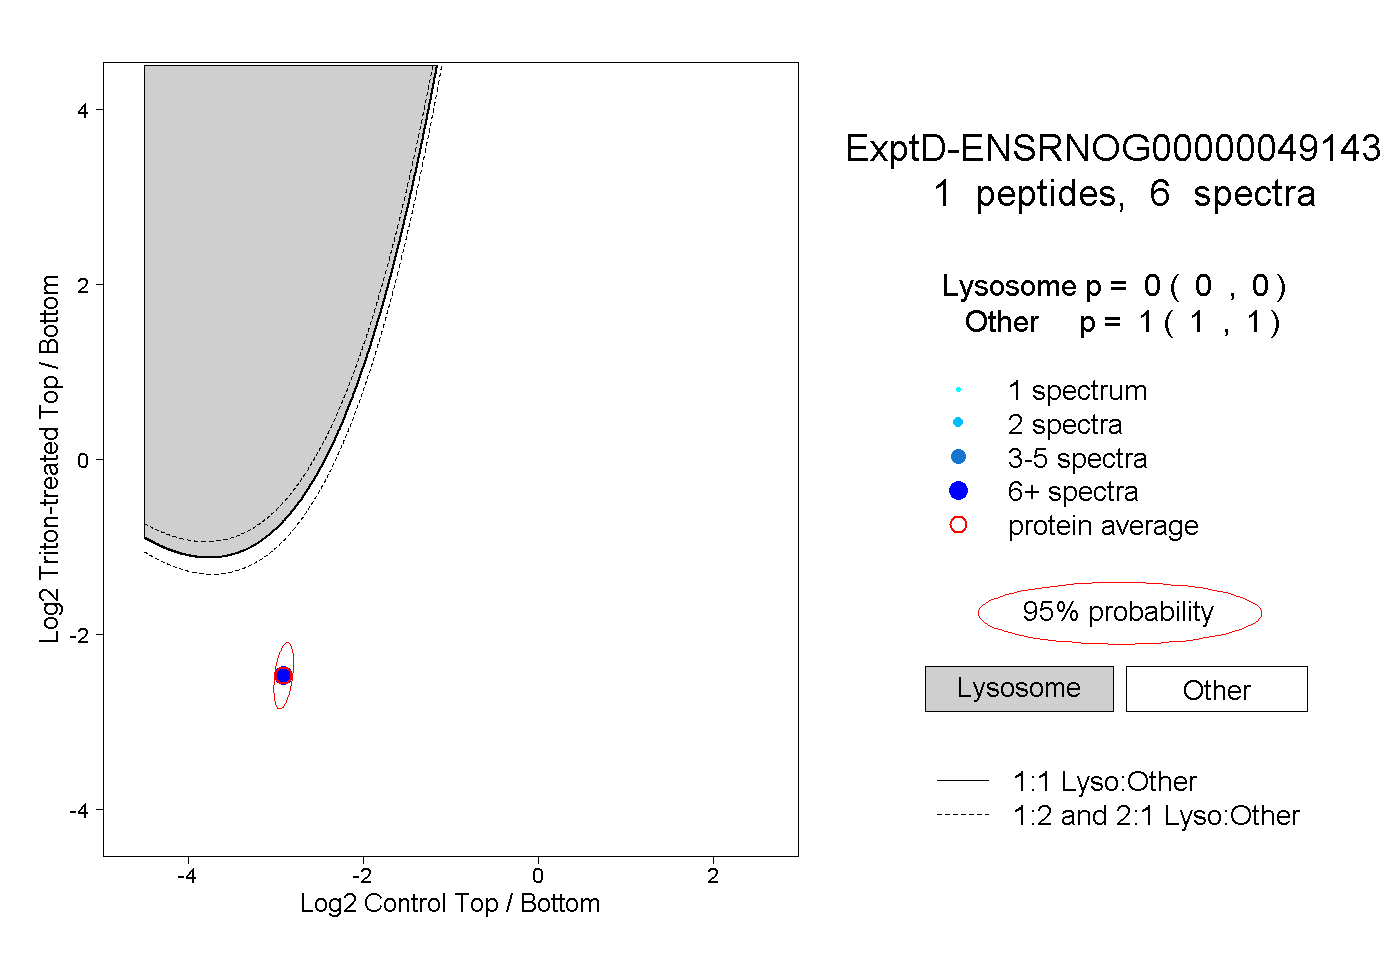
0.000 | 0.000
1.000 | 1.000