 3
3peptides
spectra
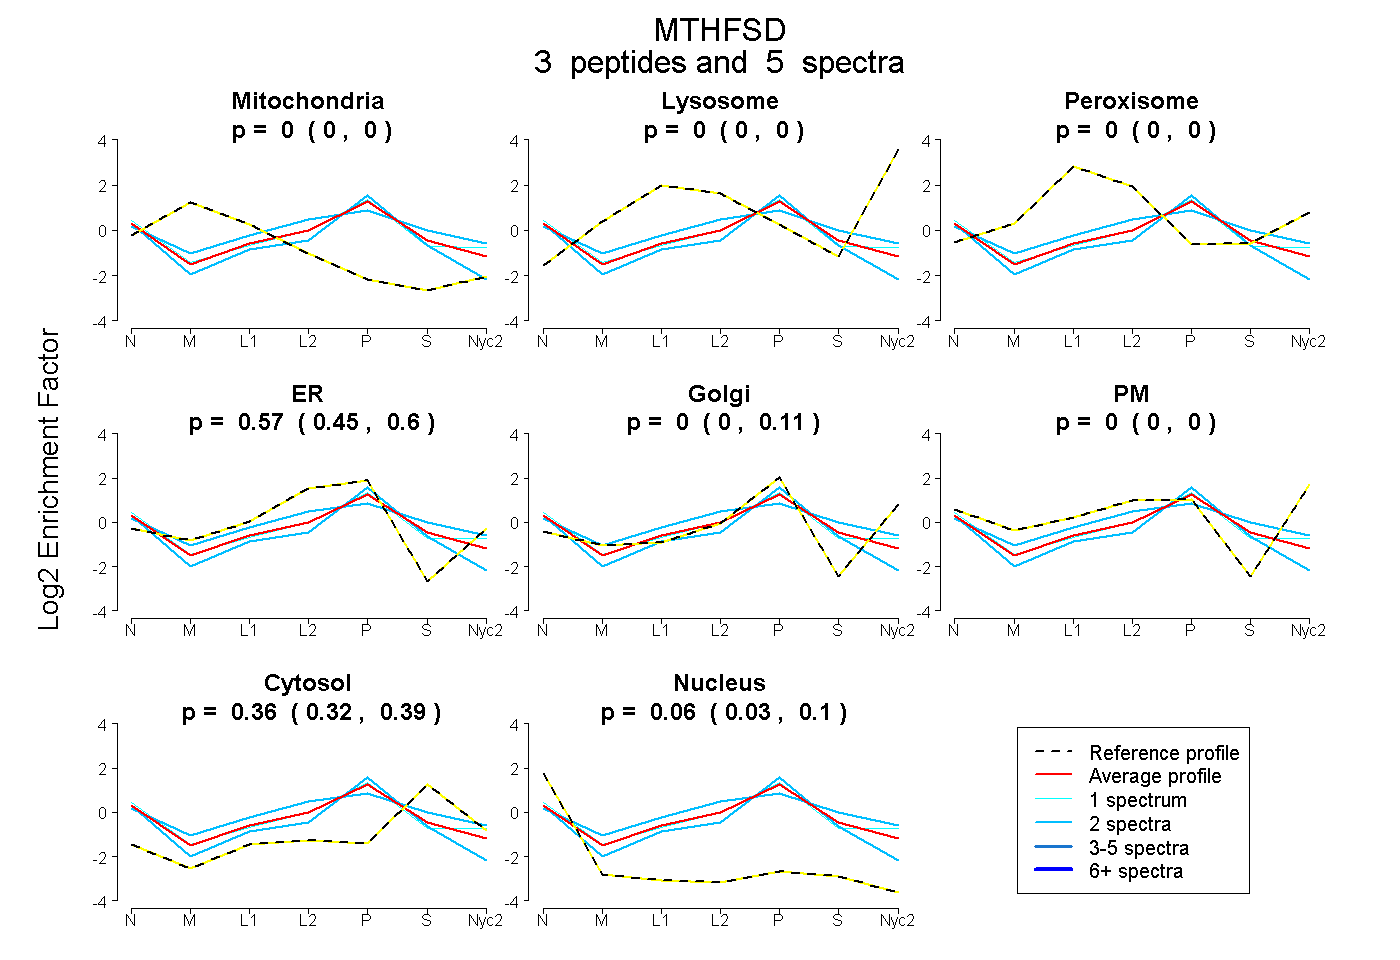
0.000 | 0.000
0.000 | 0.000
0.000 | 0.000
0.455 | 0.597
0.000 | 0.112
0.000 | 0.000
0.316 | 0.389
0.026 | 0.096
1peptide
spectra
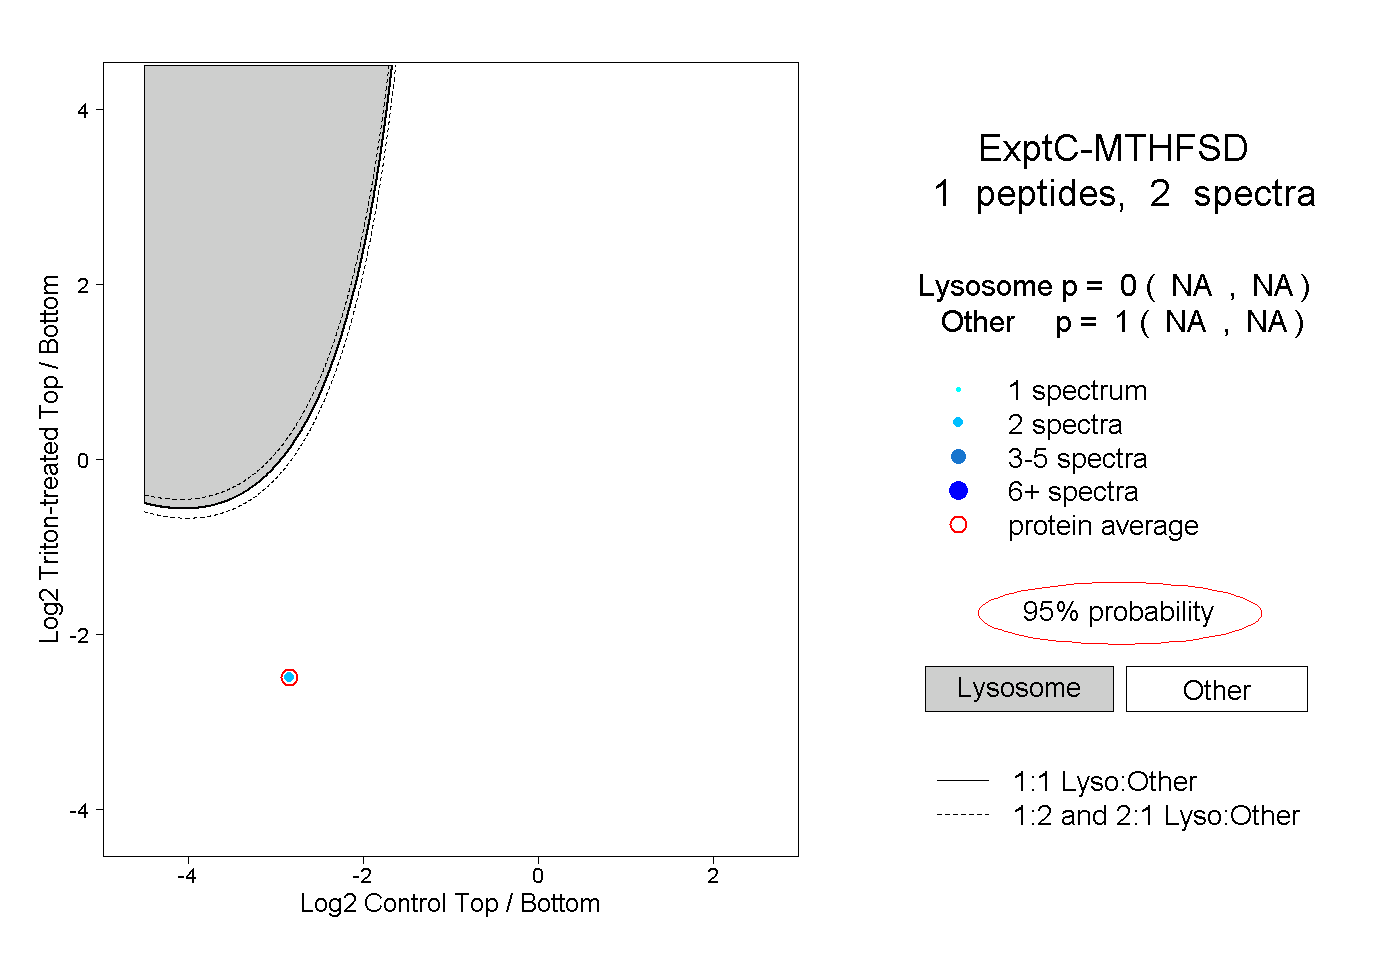
NA | NA
NA | NA
| Plot | Mito | Lyso | Perox | ER | Golgi | PM | Cytosol | Nucleus | |||||
| Expt A |
3 peptides |
5 spectra |
|
0.000 0.000 | 0.000 |
0.000 0.000 | 0.000 |
0.000 0.000 | 0.000 |
0.575 0.455 | 0.597 |
0.000 0.000 | 0.112 |
0.000 0.000 | 0.000 |
0.360 0.316 | 0.389 |
0.065 0.026 | 0.096 |
||
| Plot | Lyso | Other | |||||||||||
| Expt C |
1 peptide |
2 spectra |
|
0.000 NA | NA |
1.000 NA | NA |