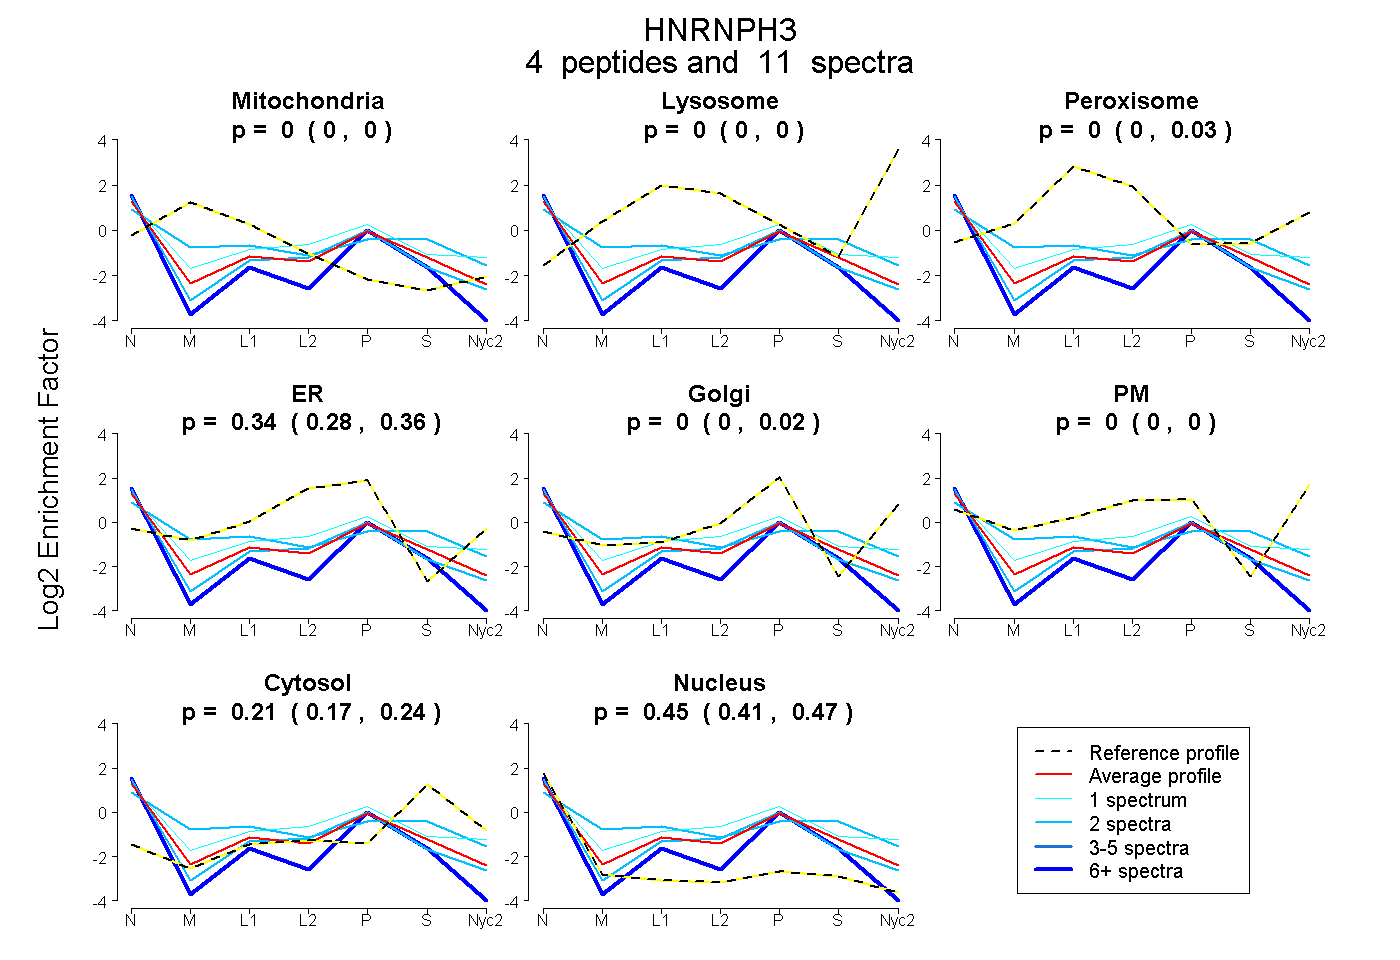
 4
4peptides
spectra
0.000 | 0.000
0.000 | 0.000
0.000 | 0.029
0.280 | 0.362
0.000 | 0.021
0.000 | 0.000
0.165 | 0.242
0.412 | 0.474
| Plot | Mito | Lyso | Perox | ER | Golgi | PM | Cytosol | Nucleus | |||||
| Expt A |
4 peptides |
11 spectra |
|
0.000 0.000 | 0.000 |
0.000 0.000 | 0.000 |
0.000 0.000 | 0.029 |
0.344 0.280 | 0.362 |
0.000 0.000 | 0.021 |
0.000 0.000 | 0.000 |
0.211 0.165 | 0.242 |
0.446 0.412 | 0.474 |
| 1 spectrum, VHIDIGADGR | 0.000 | 0.000 | 0.019 | 0.276 | 0.000 | 0.203 | 0.214 | 0.287 | ||
| 6 spectra, DGMDNQGGYGSVGR | 0.000 | 0.000 | 0.000 | 0.177 | 0.000 | 0.000 | 0.113 | 0.710 | ||
| 2 spectra, EIAENALGK | 0.072 | 0.000 | 0.248 | 0.003 | 0.151 | 0.000 | 0.230 | 0.297 | ||
| 2 spectra, HNGPNDASDGTVR | 0.000 | 0.000 | 0.000 | 0.359 | 0.000 | 0.000 | 0.122 | 0.518 |
| Plot | Lyso | Other | |||||||||||
| Expt C |
3 peptides |
5 spectra |
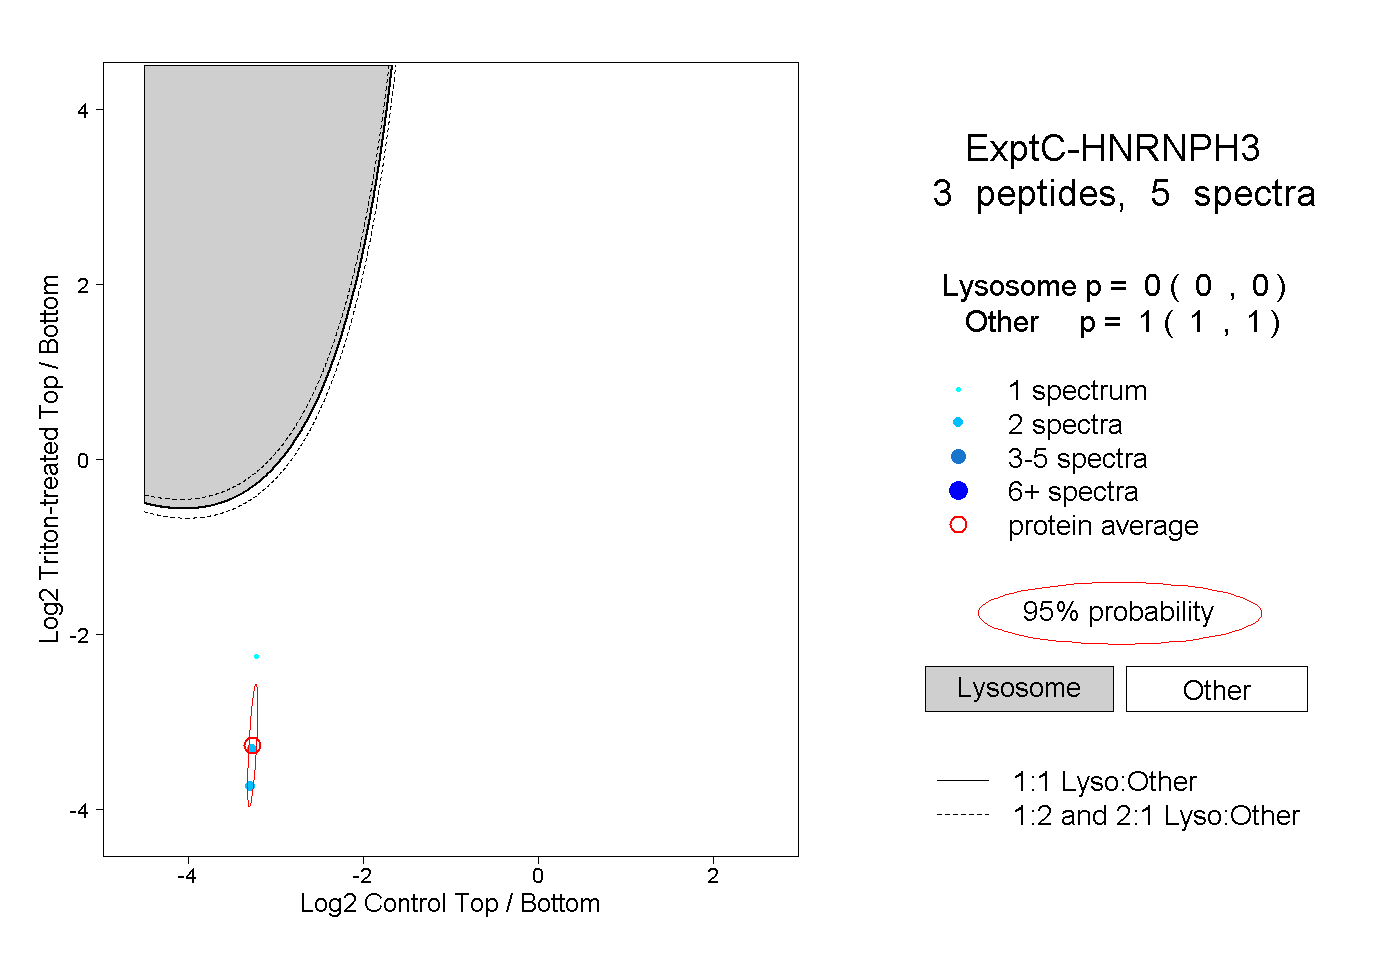 |
0.000 0.000 | 0.000 |
1.000 1.000 | 1.000 |
||||||||
| Plot | Lyso | Other | |||||||||||
| Expt D |
1 peptide |
1 spectrum |
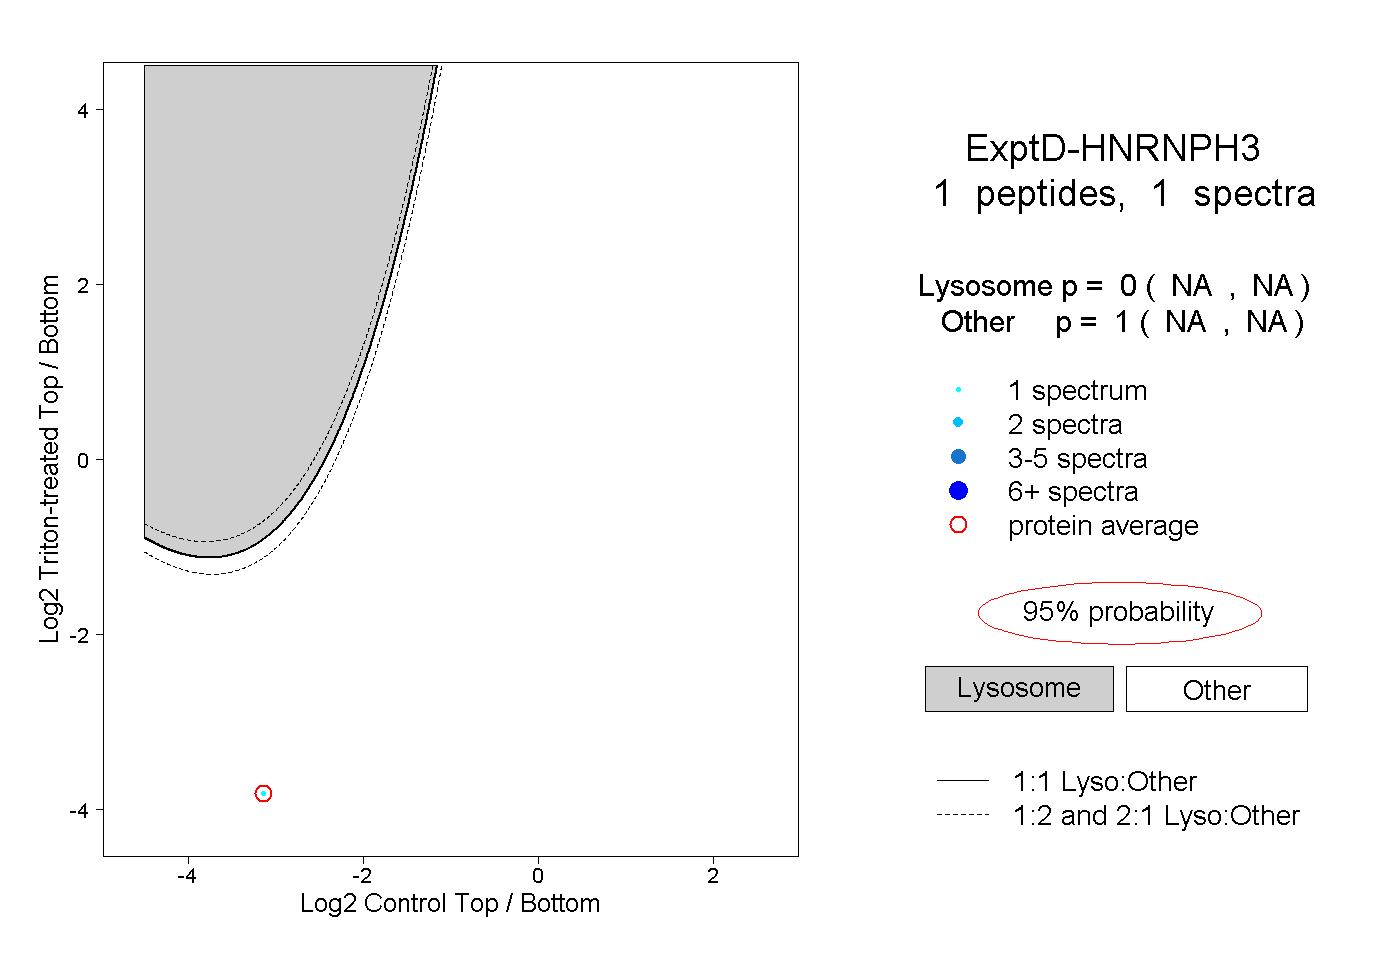 |
0.000 NA | NA |
1.000 NA | NA |