 7
7peptides
spectra
0.000 | 0.000
0.000 | 0.000
0.000 | 0.000
0.232 | 0.341
0.000 | 0.028
0.000 | 0.085
0.389 | 0.419
0.239 | 0.273
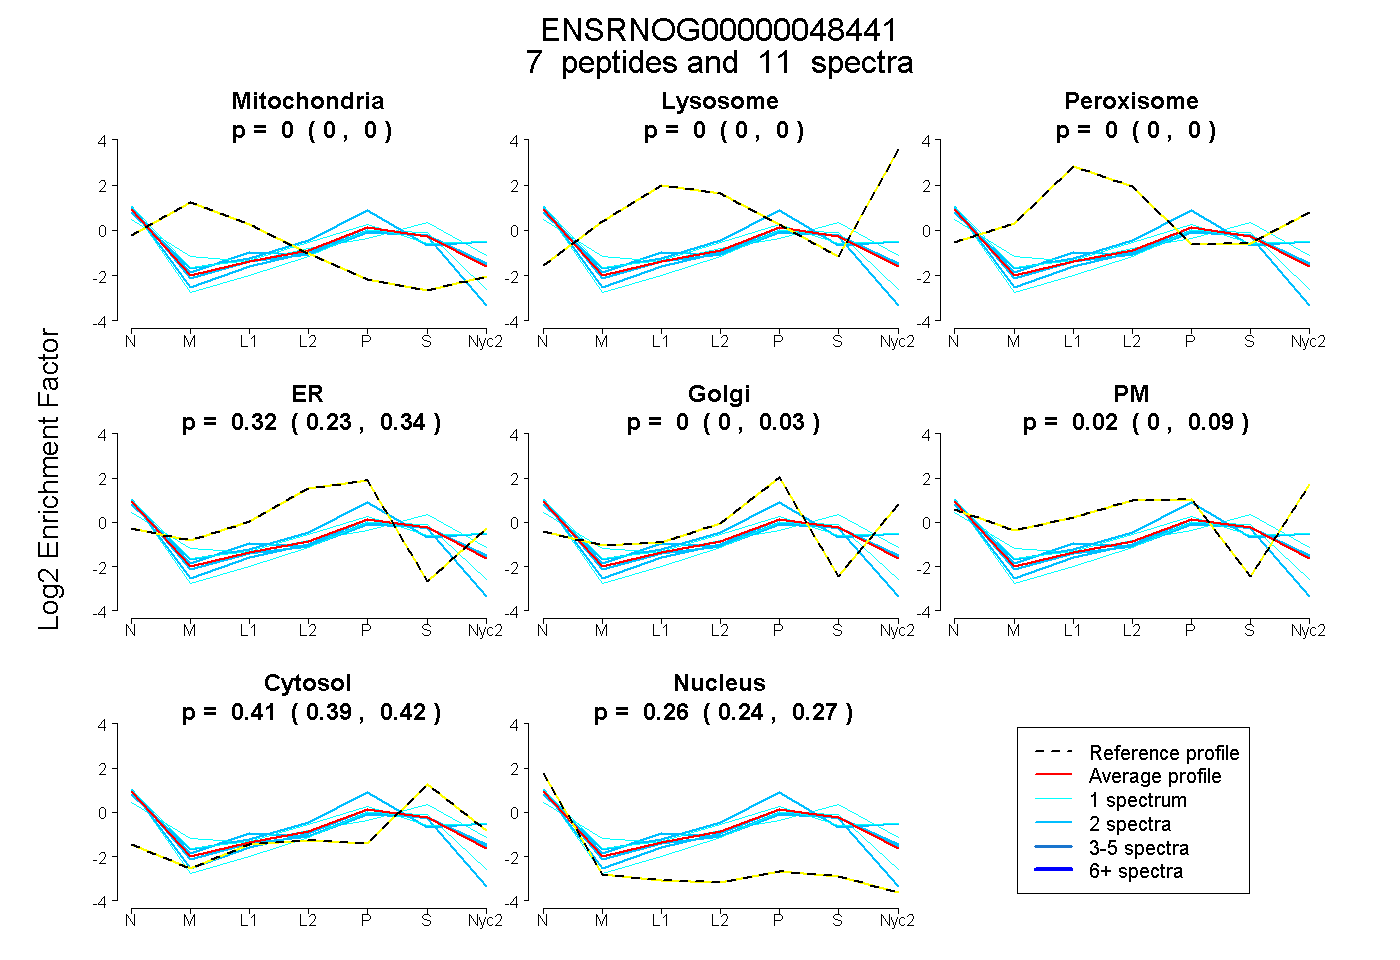
| Plot | Mito | Lyso | Perox | ER | Golgi | PM | Cytosol | Nucleus | |||||
| Expt A |
7 peptides |
11 spectra |
|
0.000 0.000 | 0.000 |
0.000 0.000 | 0.000 |
0.000 0.000 | 0.000 |
0.317 0.232 | 0.341 |
0.000 0.000 | 0.028 |
0.020 0.000 | 0.085 |
0.407 0.389 | 0.419 |
0.256 0.239 | 0.273 |
| 2 spectra, TCEWTGIK | 0.000 | 0.000 | 0.000 | 0.259 | 0.000 | 0.000 | 0.335 | 0.406 | ||
| 2 spectra, LIDAFK | 0.000 | 0.000 | 0.000 | 0.201 | 0.000 | 0.101 | 0.413 | 0.284 | ||
| 1 spectrum, HTGPITCLQFNPK | 0.040 | 0.000 | 0.006 | 0.079 | 0.000 | 0.195 | 0.544 | 0.136 | ||
| 1 spectrum, LTDSVLR | 0.000 | 0.000 | 0.000 | 0.211 | 0.000 | 0.000 | 0.414 | 0.375 | ||
| 1 spectrum, YFPGHSK | 0.000 | 0.000 | 0.000 | 0.027 | 0.082 | 0.366 | 0.325 | 0.200 | ||
| 2 spectra, GVVMHTFGGYANSK | 0.000 | 0.000 | 0.036 | 0.199 | 0.000 | 0.111 | 0.392 | 0.262 | ||
| 2 spectra, VAVLDGK | 0.000 | 0.000 | 0.000 | 0.117 | 0.298 | 0.152 | 0.293 | 0.140 |
| Plot | Mito | Lyso or Perox | ER | Golgi | PM | Cytosol | Nucleus | ||||||
| Expt B |
2 peptides |
2 spectra |
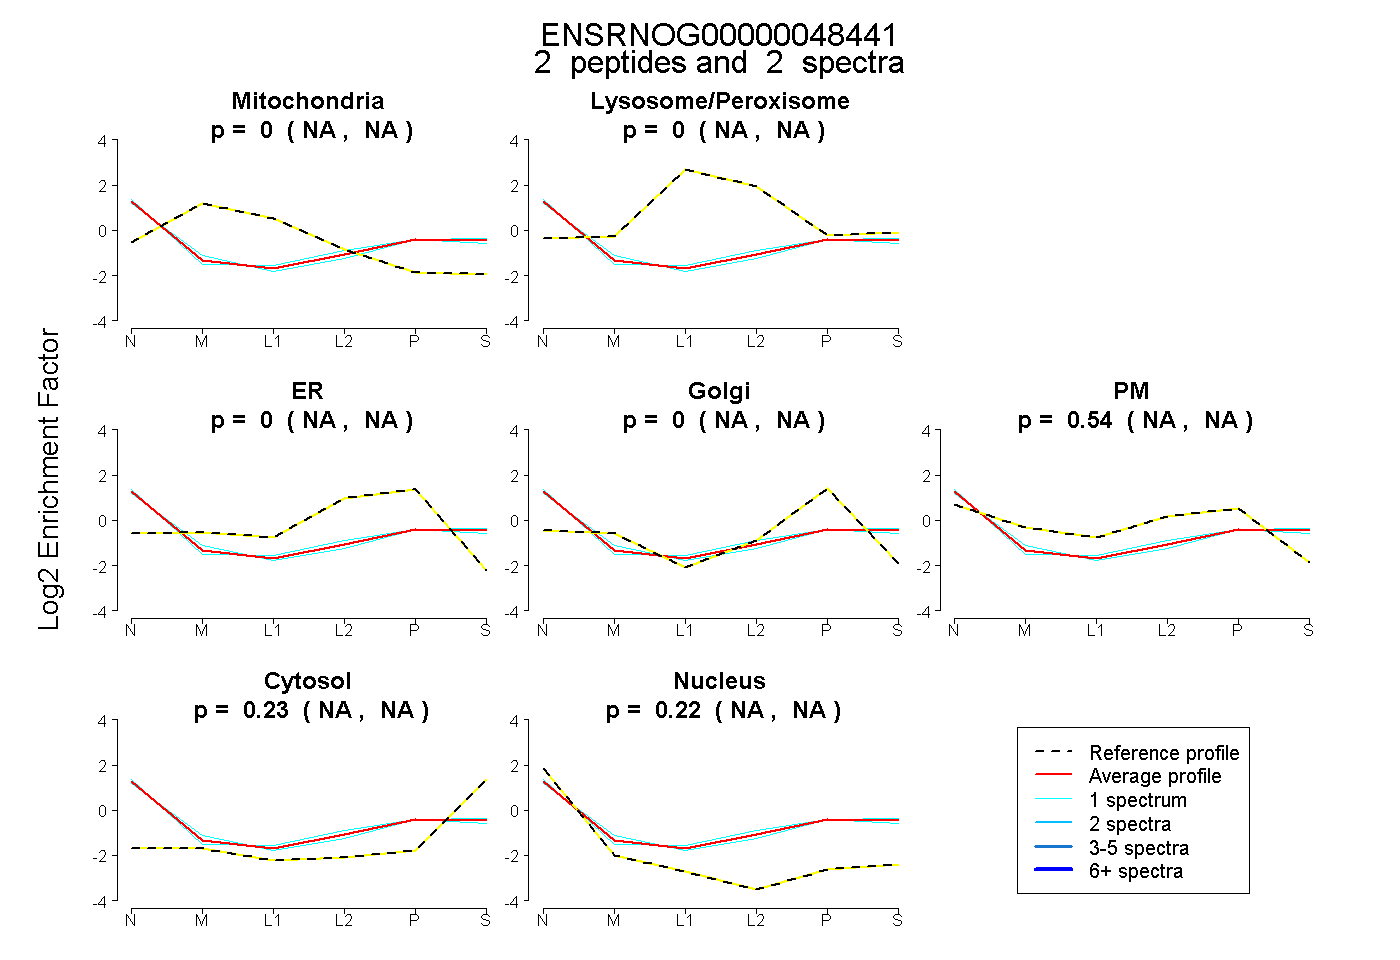 |
0.000 NA | NA |
0.000 NA | NA |
0.000 NA | NA |
0.000 NA | NA |
0.541 NA | NA |
0.235 NA | NA |
0.224 NA | NA |
|||
| Plot | Lyso | Other | |||||||||||
| Expt C |
3 peptides |
4 spectra |
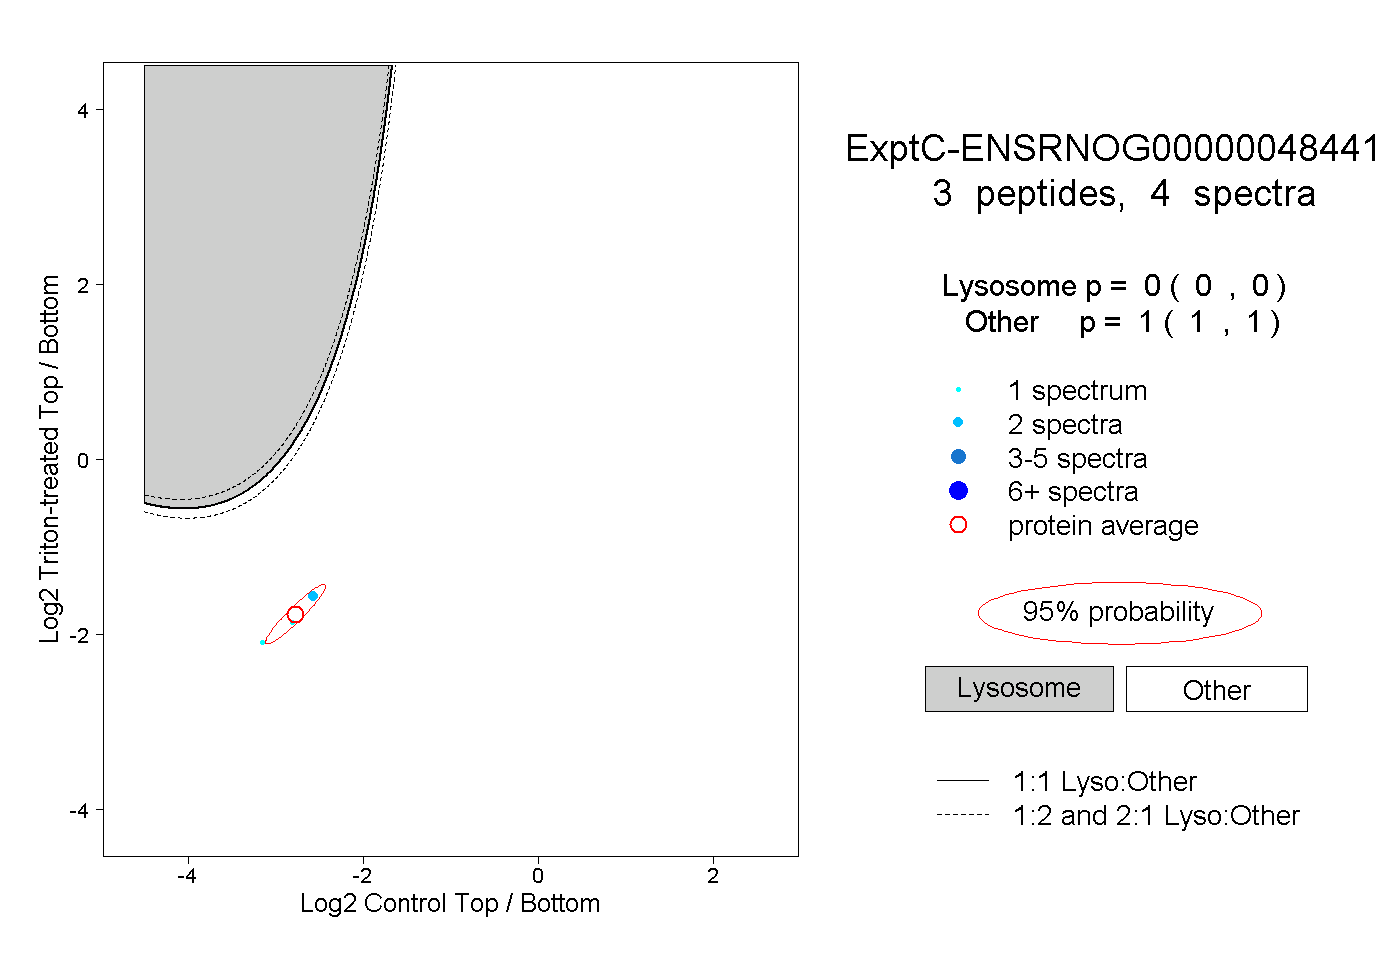 |
0.000 0.000 | 0.000 |
1.000 1.000 | 1.000 |
||||||||
| Plot | Lyso | Other | |||||||||||
| Expt D |
1 peptide |
1 spectrum |
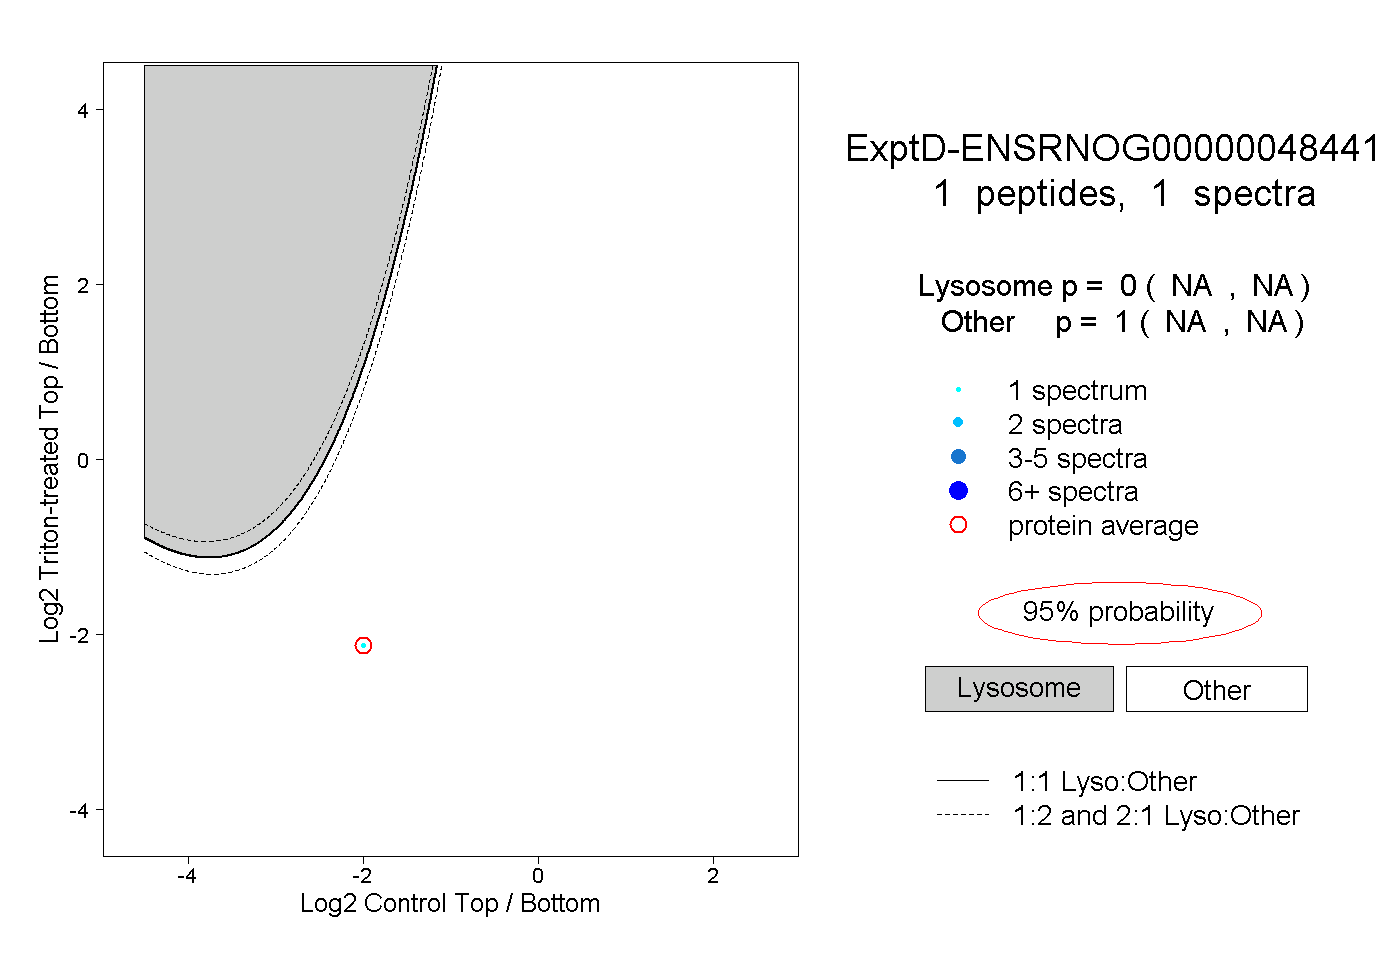 |
0.000 NA | NA |
1.000 NA | NA |