 16
16peptides
spectra
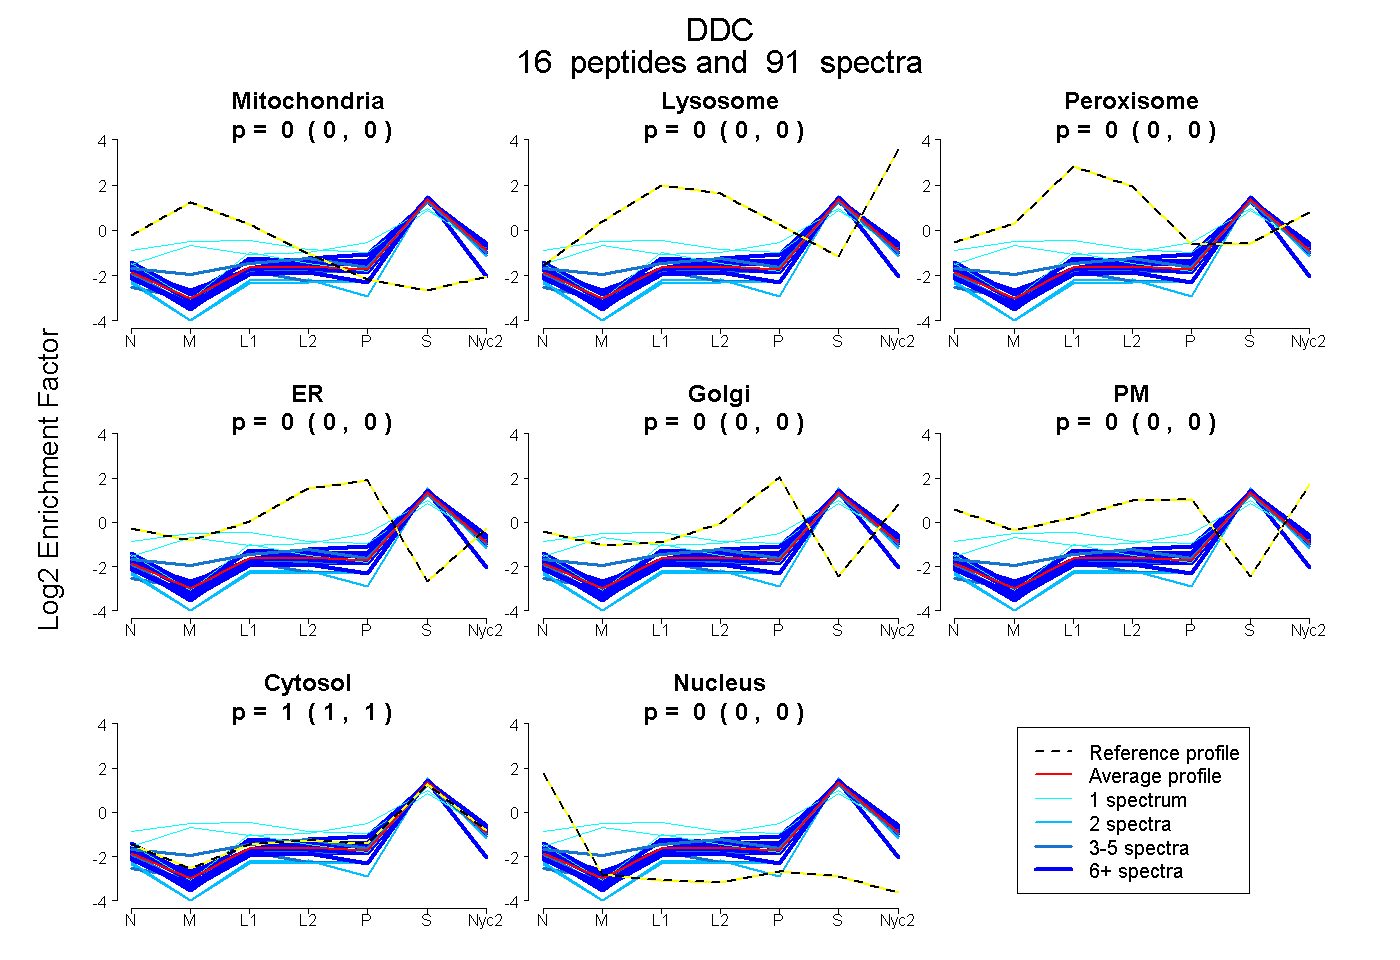
0.000 | 0.000
0.000 | 0.000
0.000 | 0.000
0.000 | 0.000
0.000 | 0.000
0.000 | 0.000
1.000 | 1.000
0.000 | 0.000
11peptides
spectra
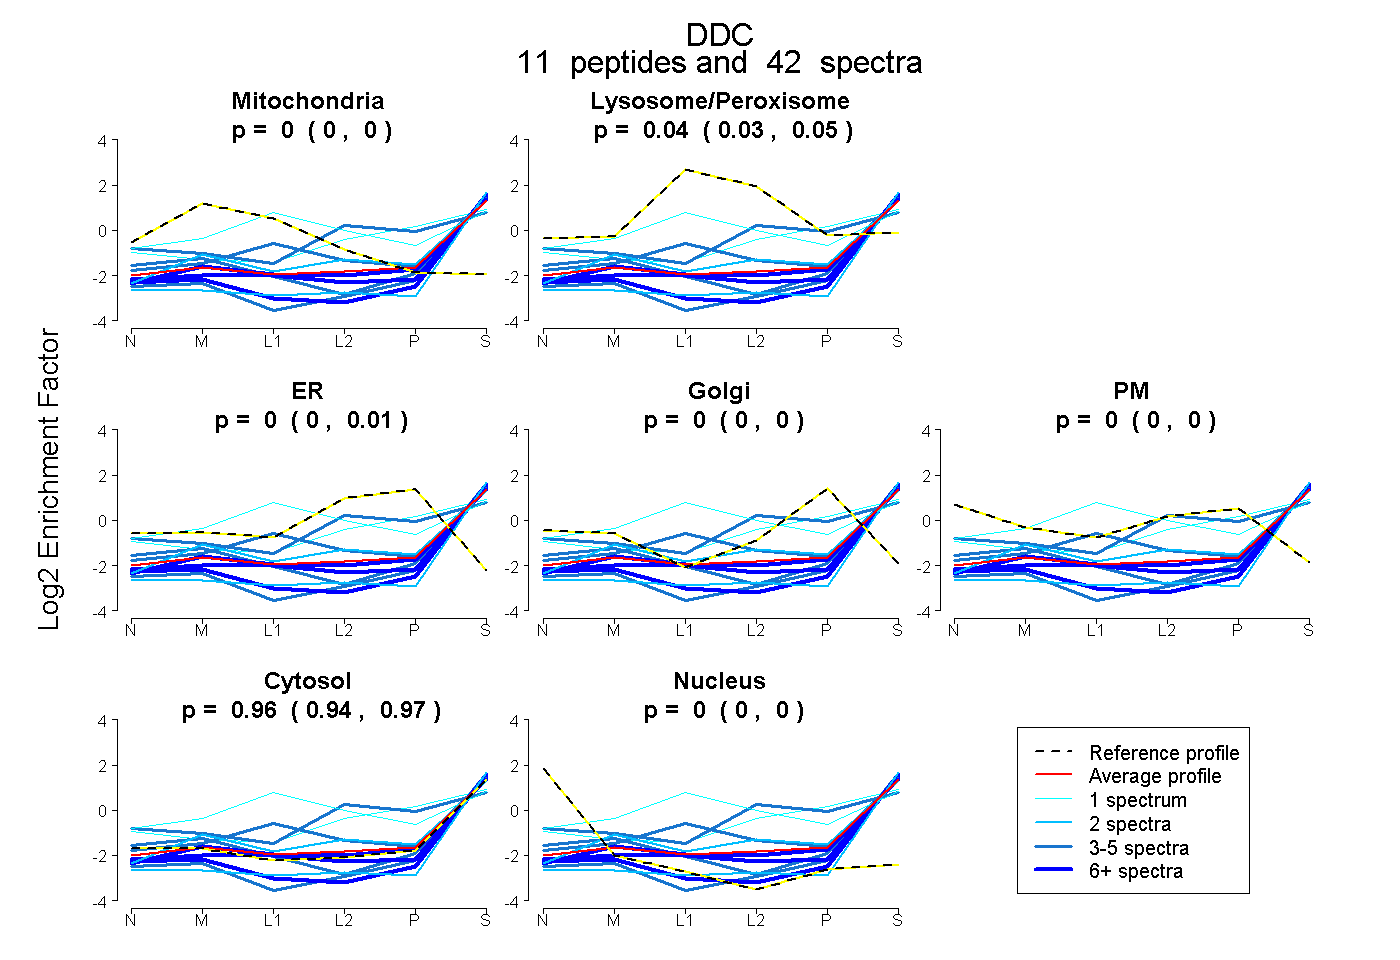
0.000 | 0.000
0.029 | 0.054
0.000 | 0.006
0.000 | 0.000
0.000 | 0.000
0.942 | 0.968
0.000 | 0.000
11peptides
spectra
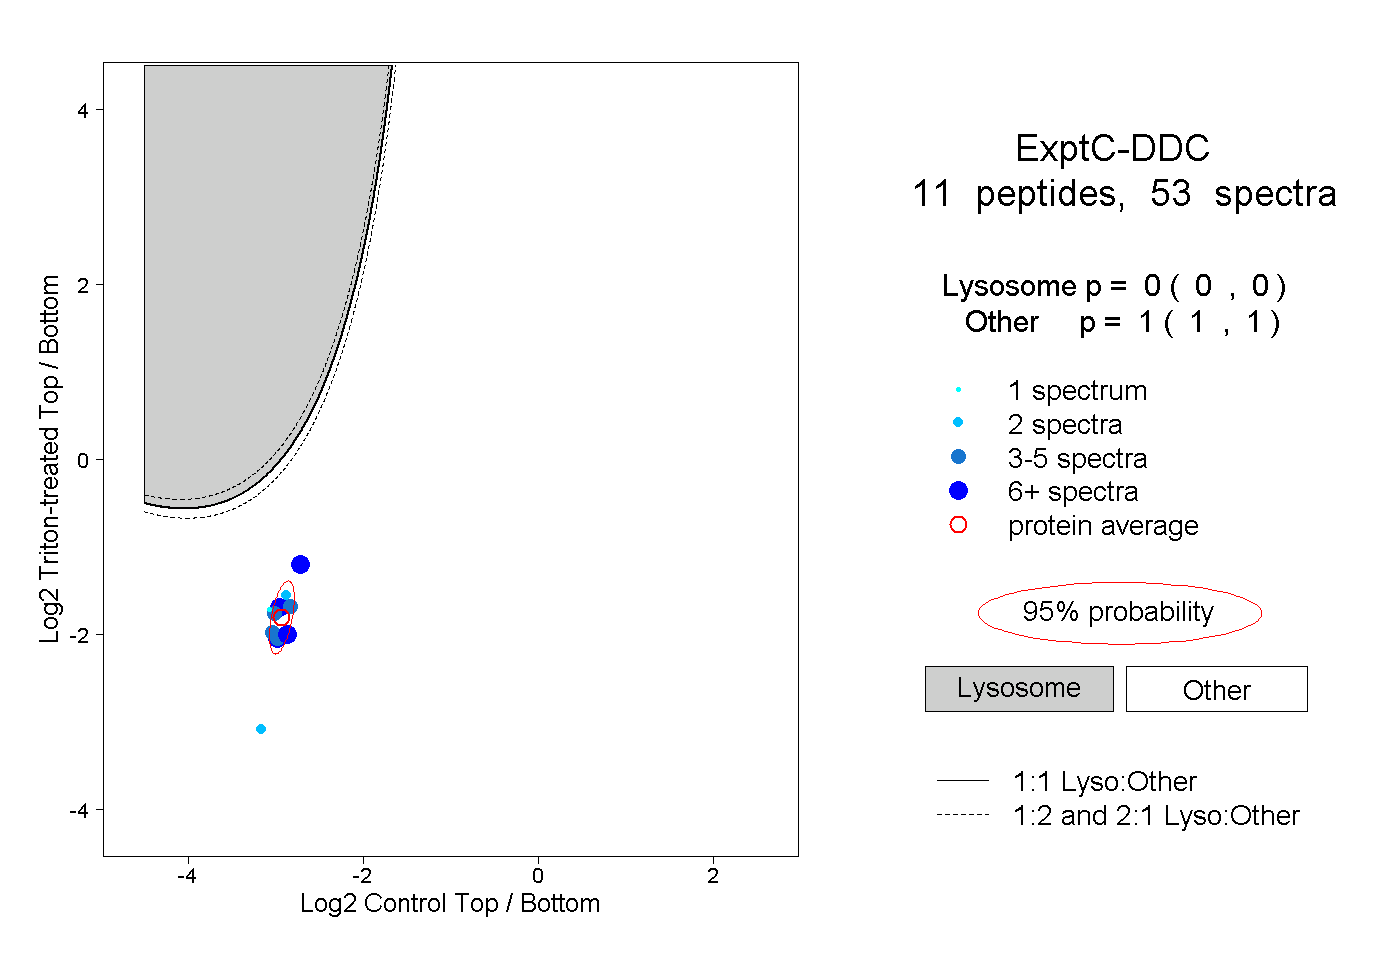
0.000 | 0.000
1.000 | 1.000
5peptides
spectra
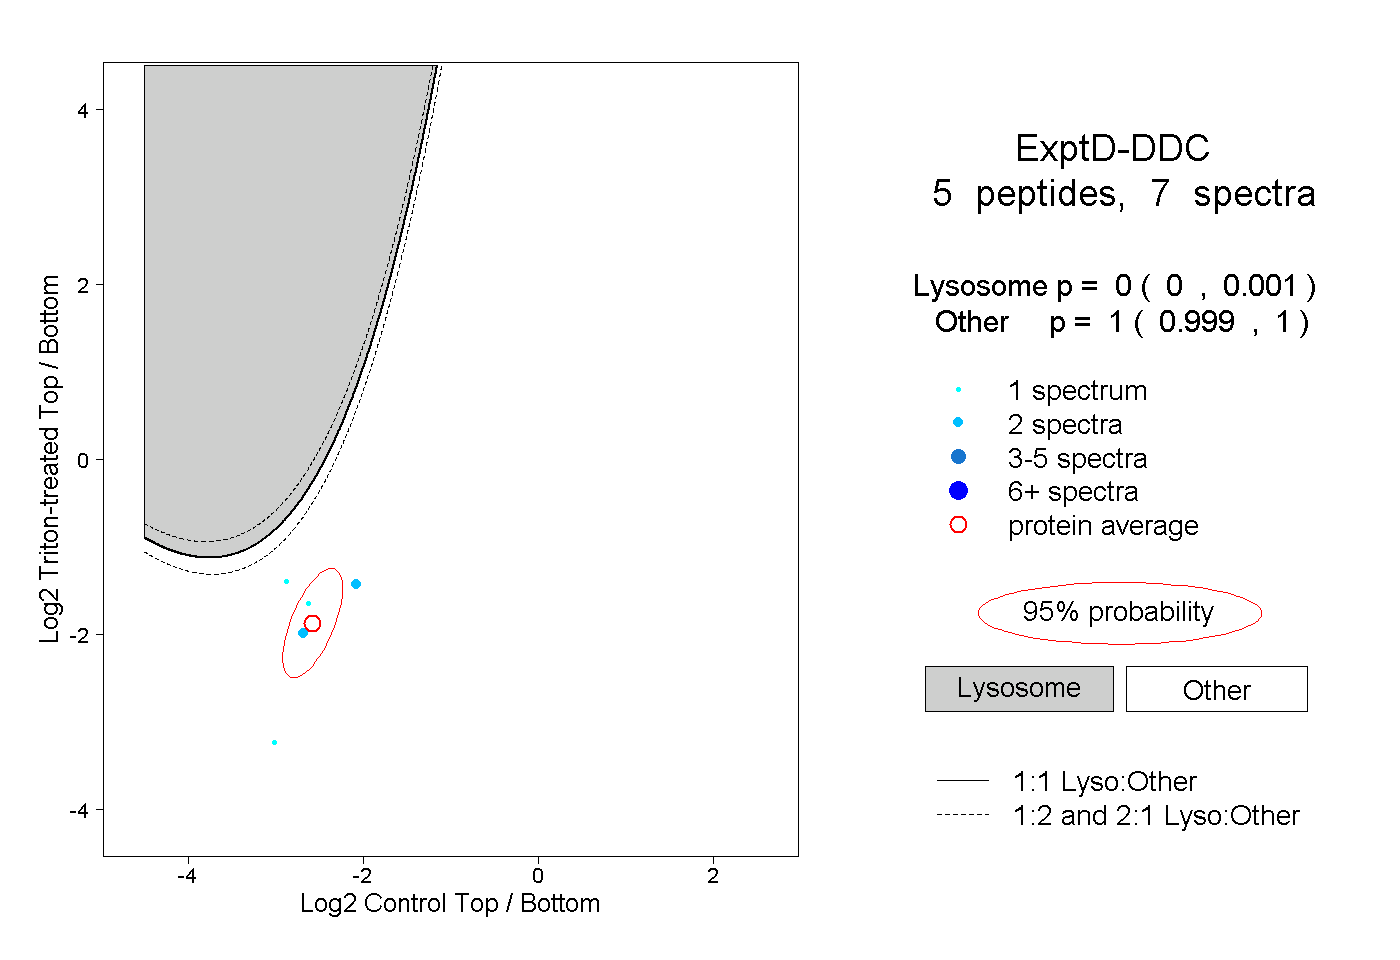
0.000 | 0.001
0.999 | 1.000