 14
14peptides
spectra
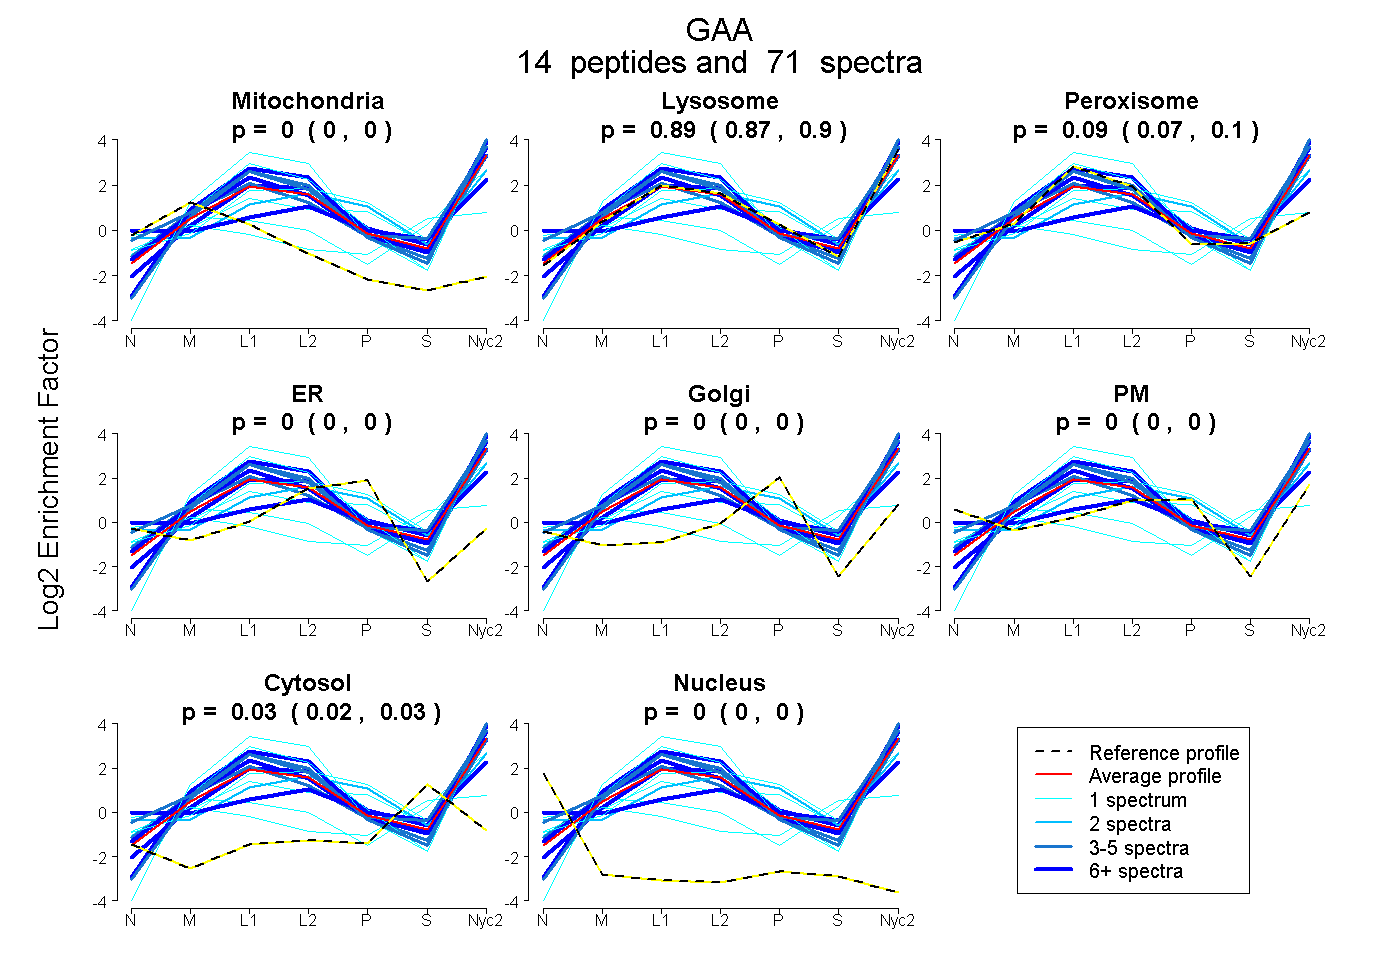
0.000 | 0.000
0.872 | 0.899
0.070 | 0.103
0.000 | 0.000
0.000 | 0.000
0.000 | 0.000
0.018 | 0.031
0.000 | 0.000
12peptides
spectra
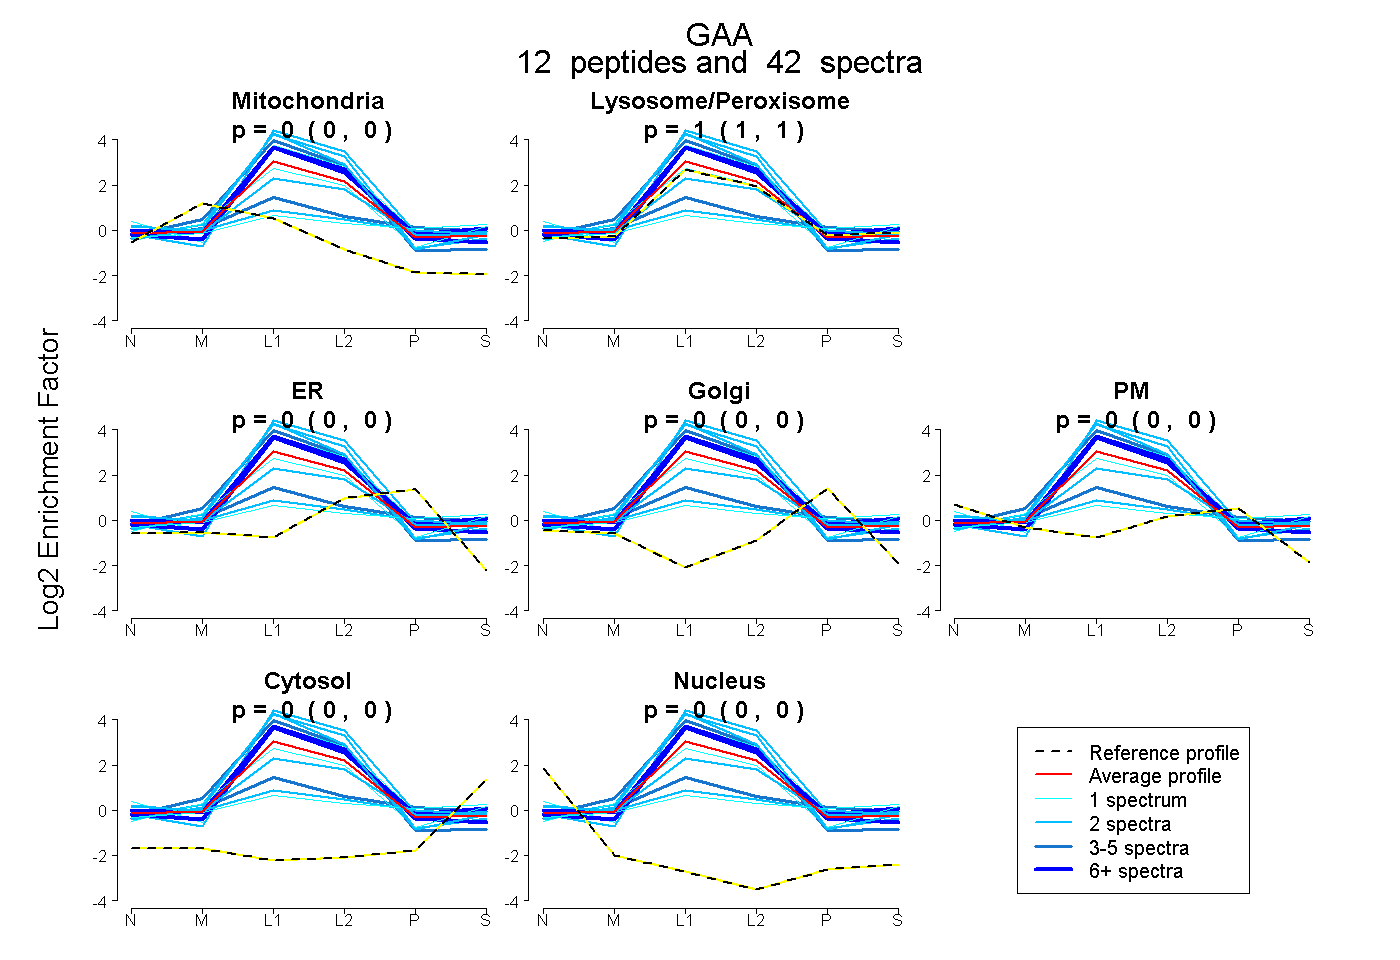
0.000 | 0.000
1.000 | 1.000
0.000 | 0.000
0.000 | 0.000
0.000 | 0.000
0.000 | 0.000
0.000 | 0.000
23peptides
spectra
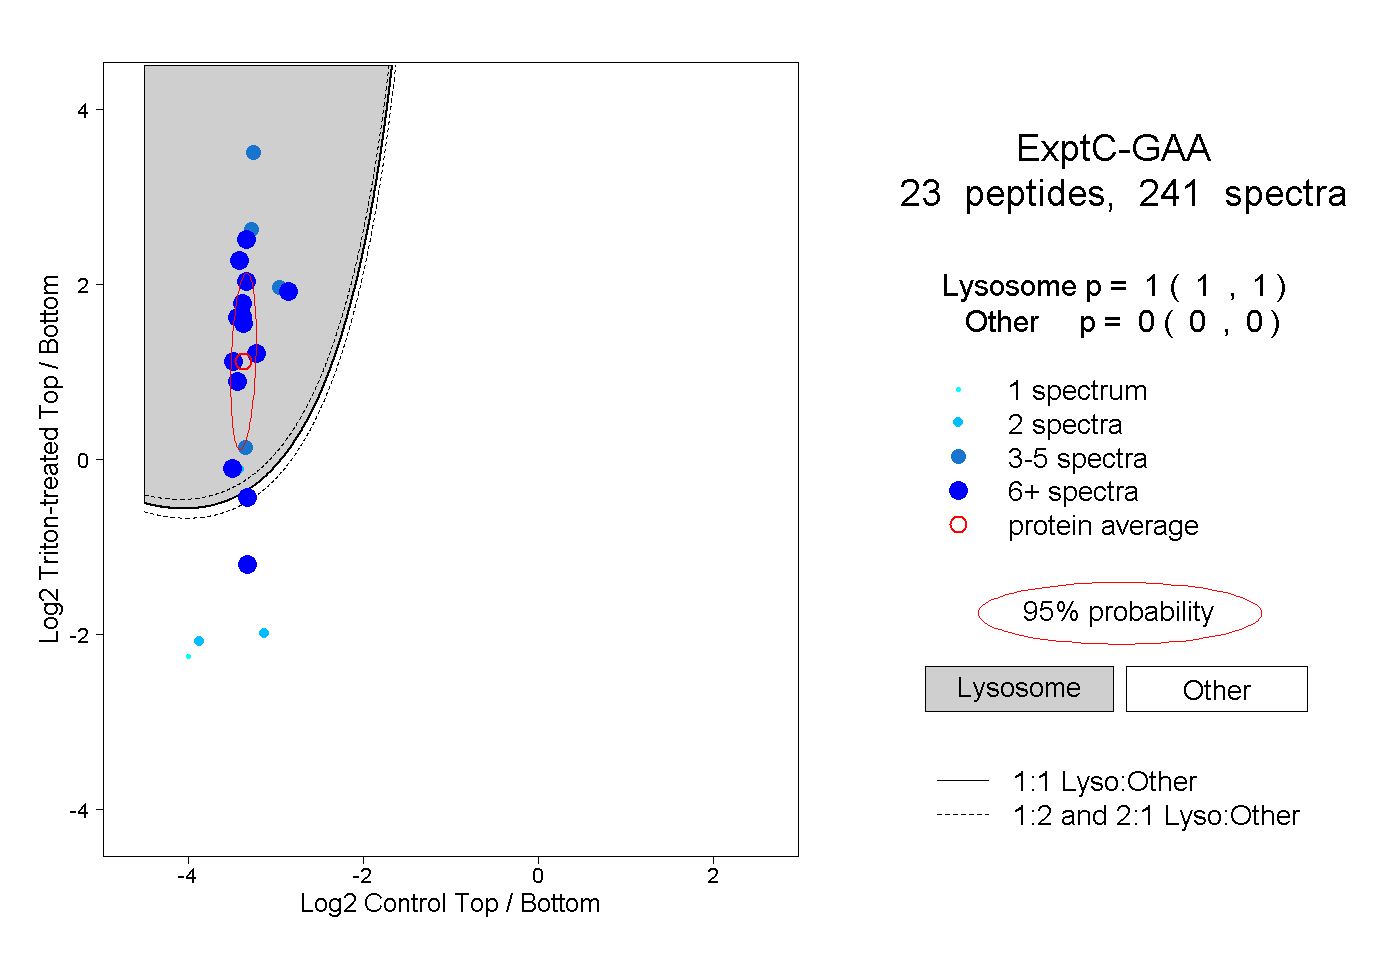
1.000 | 1.000
0.000 | 0.000
8peptides
spectra
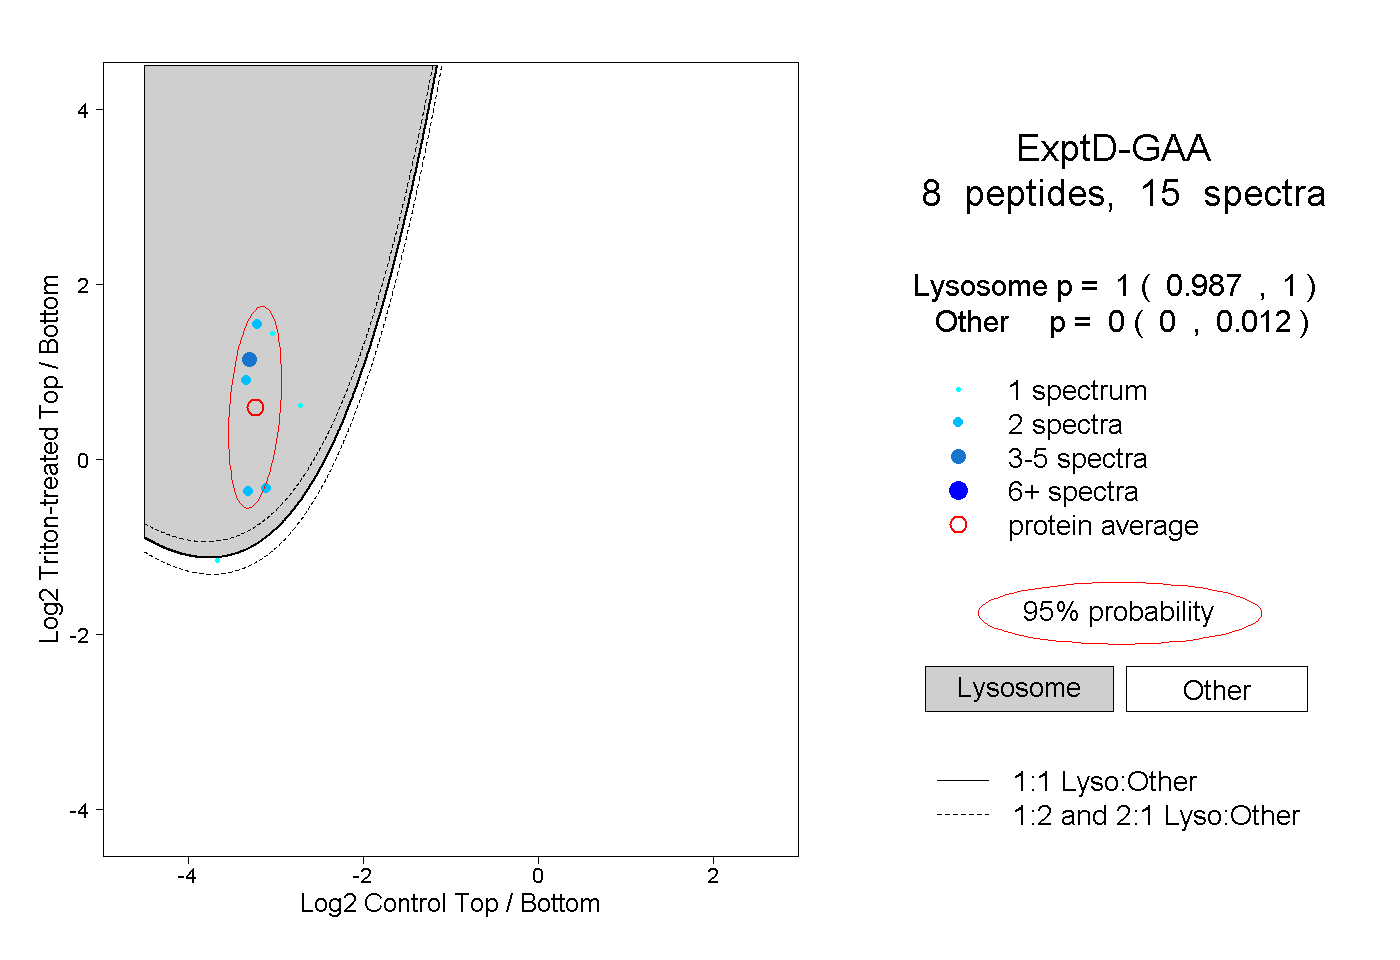
0.987 | 1.000
0.000 | 0.012