 14
14peptides
spectra
0.000 | 0.000
0.872 | 0.899
0.070 | 0.103
0.000 | 0.000
0.000 | 0.000
0.000 | 0.000
0.018 | 0.031
0.000 | 0.000
| Plot | Mito | Lyso | Perox | ER | Golgi | PM | Cytosol | Nucleus | |||||
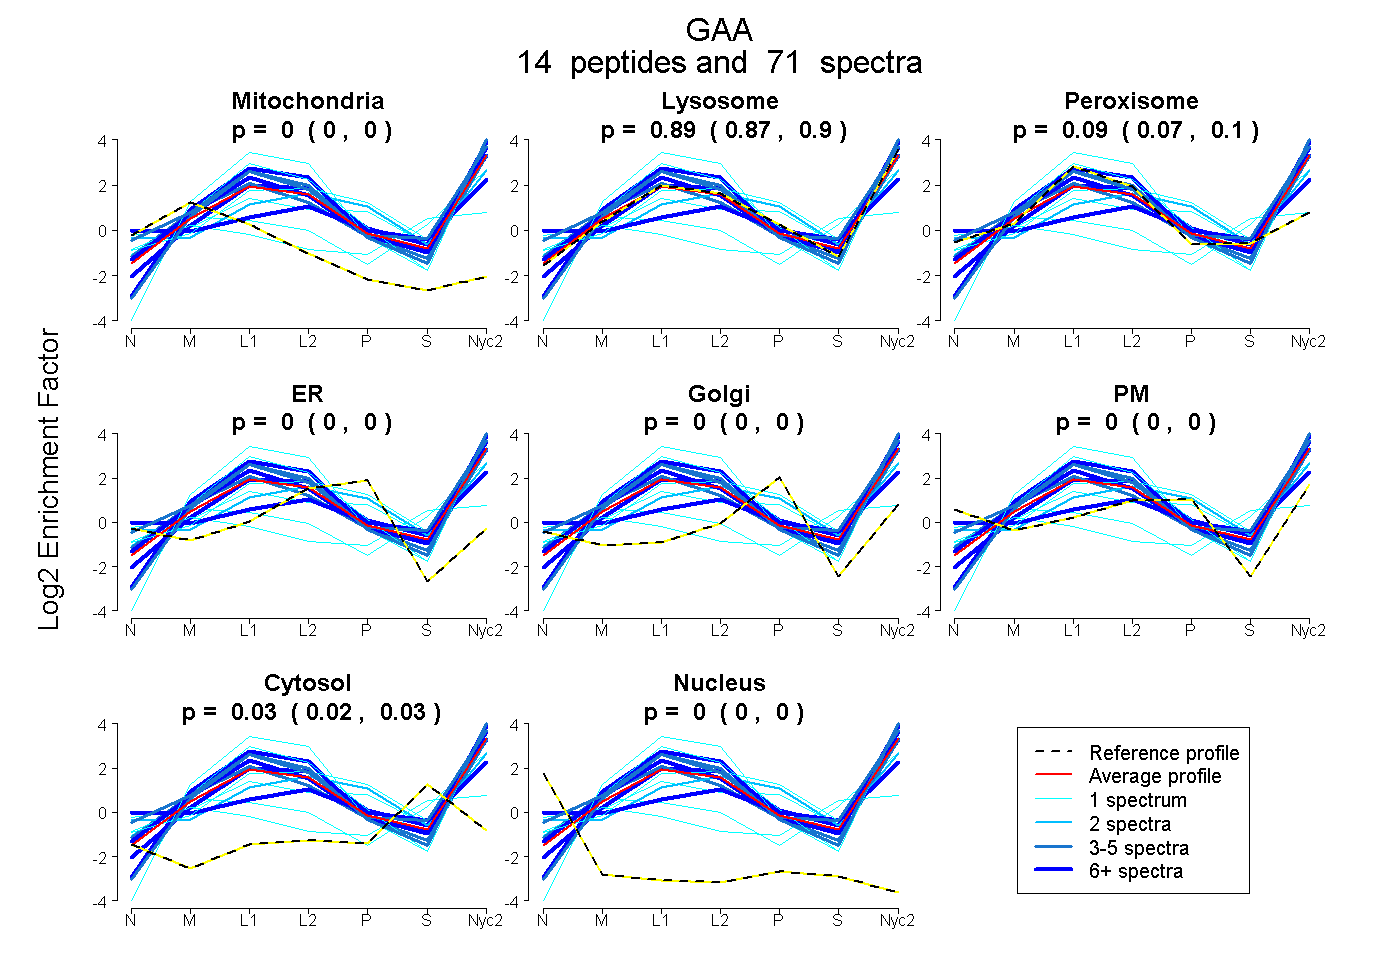
| Expt A |
14 peptides |
71 spectra |
|
0.000 0.000 | 0.000 |
0.887 0.872 | 0.899 |
0.088 0.070 | 0.103 |
0.000 0.000 | 0.000 |
0.000 0.000 | 0.000 |
0.000 0.000 | 0.000 |
0.025 0.018 | 0.031 |
0.000 0.000 | 0.000 |
| 1 spectrum, GQWLTLEAPLDTINVHLR | 0.203 | 0.334 | 0.000 | 0.000 | 0.000 | 0.000 | 0.464 | 0.000 | ||
| 5 spectra, GAYTLVTFSAK | 0.089 | 0.903 | 0.008 | 0.000 | 0.000 | 0.000 | 0.000 | 0.000 | ||
| 1 spectrum, EGGELQLR | 0.000 | 0.682 | 0.000 | 0.000 | 0.000 | 0.278 | 0.040 | 0.000 | ||
| 3 spectra, YEVPLETPR | 0.000 | 0.924 | 0.076 | 0.000 | 0.000 | 0.000 | 0.000 | 0.000 | ||
| 1 spectrum, THFPLDVQWNDLDYMDAR | 0.000 | 0.913 | 0.000 | 0.000 | 0.050 | 0.037 | 0.000 | 0.000 | ||
| 6 spectra, NHNDLNSLPQEPYR | 0.000 | 0.389 | 0.101 | 0.000 | 0.000 | 0.329 | 0.181 | 0.000 | ||
| 1 spectrum, TSPTFFPK | 0.000 | 1.000 | 0.000 | 0.000 | 0.000 | 0.000 | 0.000 | 0.000 | ||
| 1 spectrum, FQIDWS | 0.081 | 0.626 | 0.000 | 0.000 | 0.000 | 0.000 | 0.294 | 0.000 | ||
| 2 spectra, GITQEQCEAR | 0.000 | 0.557 | 0.032 | 0.027 | 0.000 | 0.320 | 0.063 | 0.000 | ||
| 1 spectrum, LHFMIK | 0.000 | 0.943 | 0.057 | 0.000 | 0.000 | 0.000 | 0.000 | 0.000 | ||
| 5 spectra, WGYSSTAIVR | 0.000 | 1.000 | 0.000 | 0.000 | 0.000 | 0.000 | 0.000 | 0.000 | ||
| 19 spectra, GTRPFVISR | 0.000 | 0.926 | 0.074 | 0.000 | 0.000 | 0.000 | 0.000 | 0.000 | ||
| 15 spectra, ITLWNR | 0.000 | 1.000 | 0.000 | 0.000 | 0.000 | 0.000 | 0.000 | 0.000 | ||
| 10 spectra, FSETAQQAMR | 0.000 | 0.936 | 0.023 | 0.000 | 0.000 | 0.000 | 0.041 | 0.000 |
| Plot | Mito | Lyso or Perox | ER | Golgi | PM | Cytosol | Nucleus | ||||||
| Expt B |
12 peptides |
42 spectra |
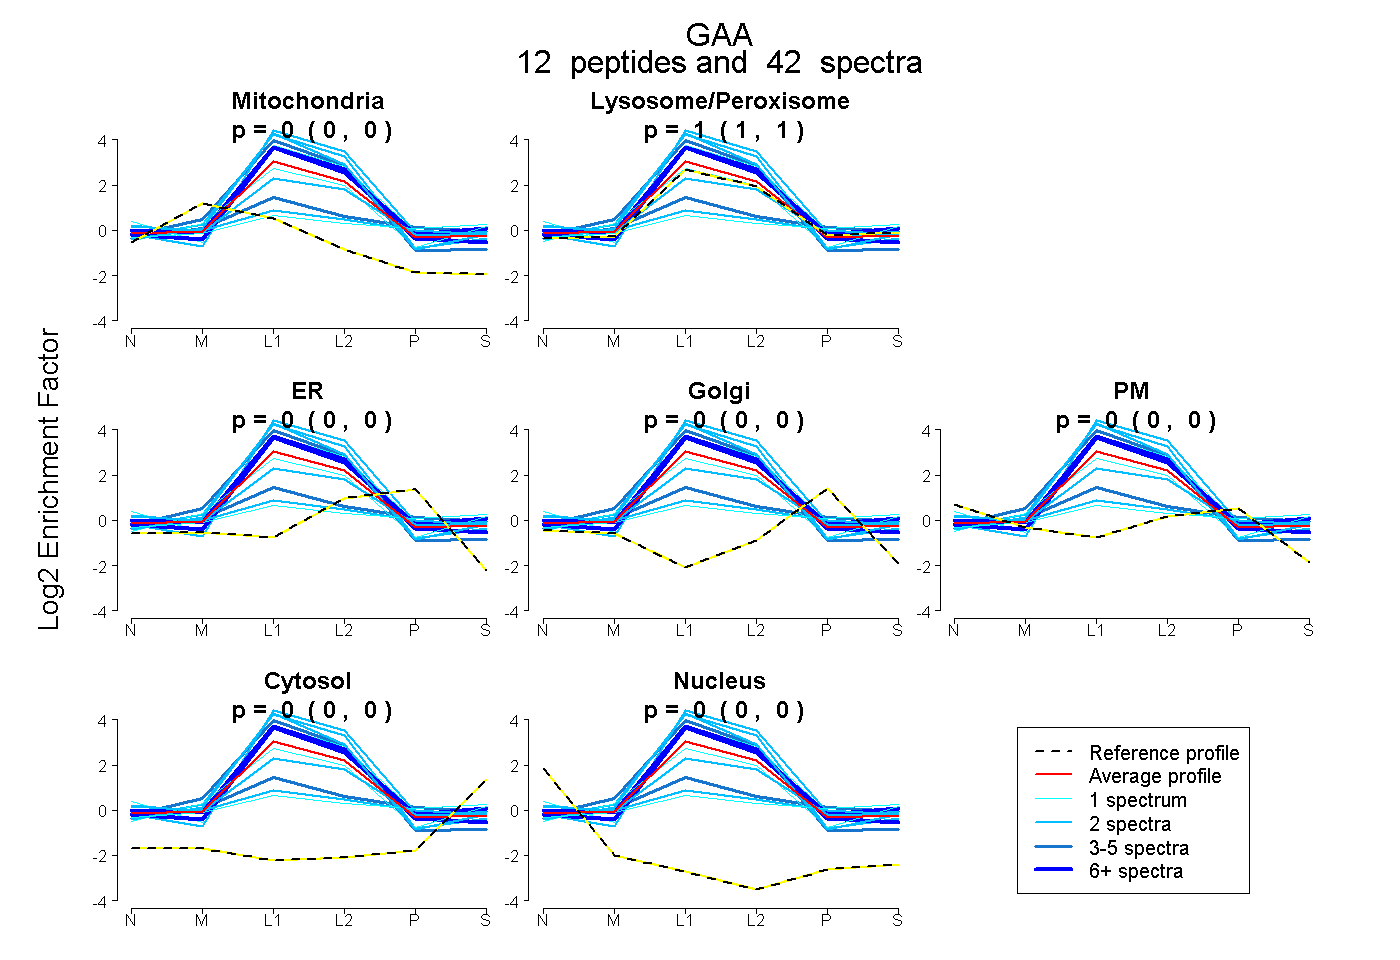 |
0.000 0.000 | 0.000 |
1.000 1.000 | 1.000 |
0.000 0.000 | 0.000 |
0.000 0.000 | 0.000 |
0.000 0.000 | 0.000 |
0.000 0.000 | 0.000 |
0.000 0.000 | 0.000 |
|||
| Plot | Lyso | Other | |||||||||||
| Expt C |
23 peptides |
241 spectra |
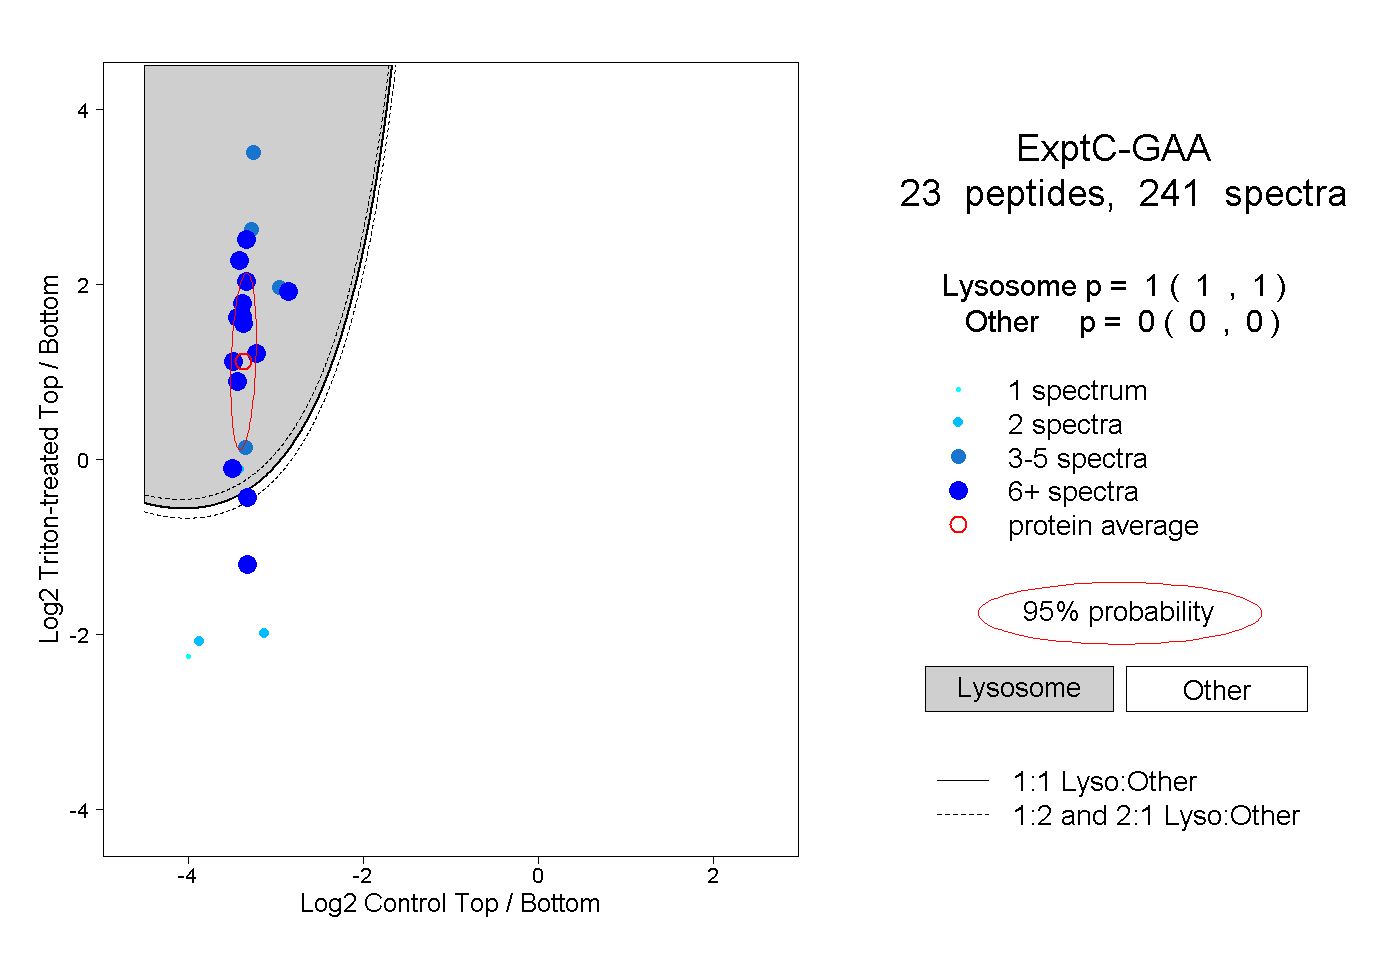 |
1.000 1.000 | 1.000 |
0.000 0.000 | 0.000 |
||||||||
| Plot | Lyso | Other | |||||||||||
| Expt D |
8 peptides |
15 spectra |
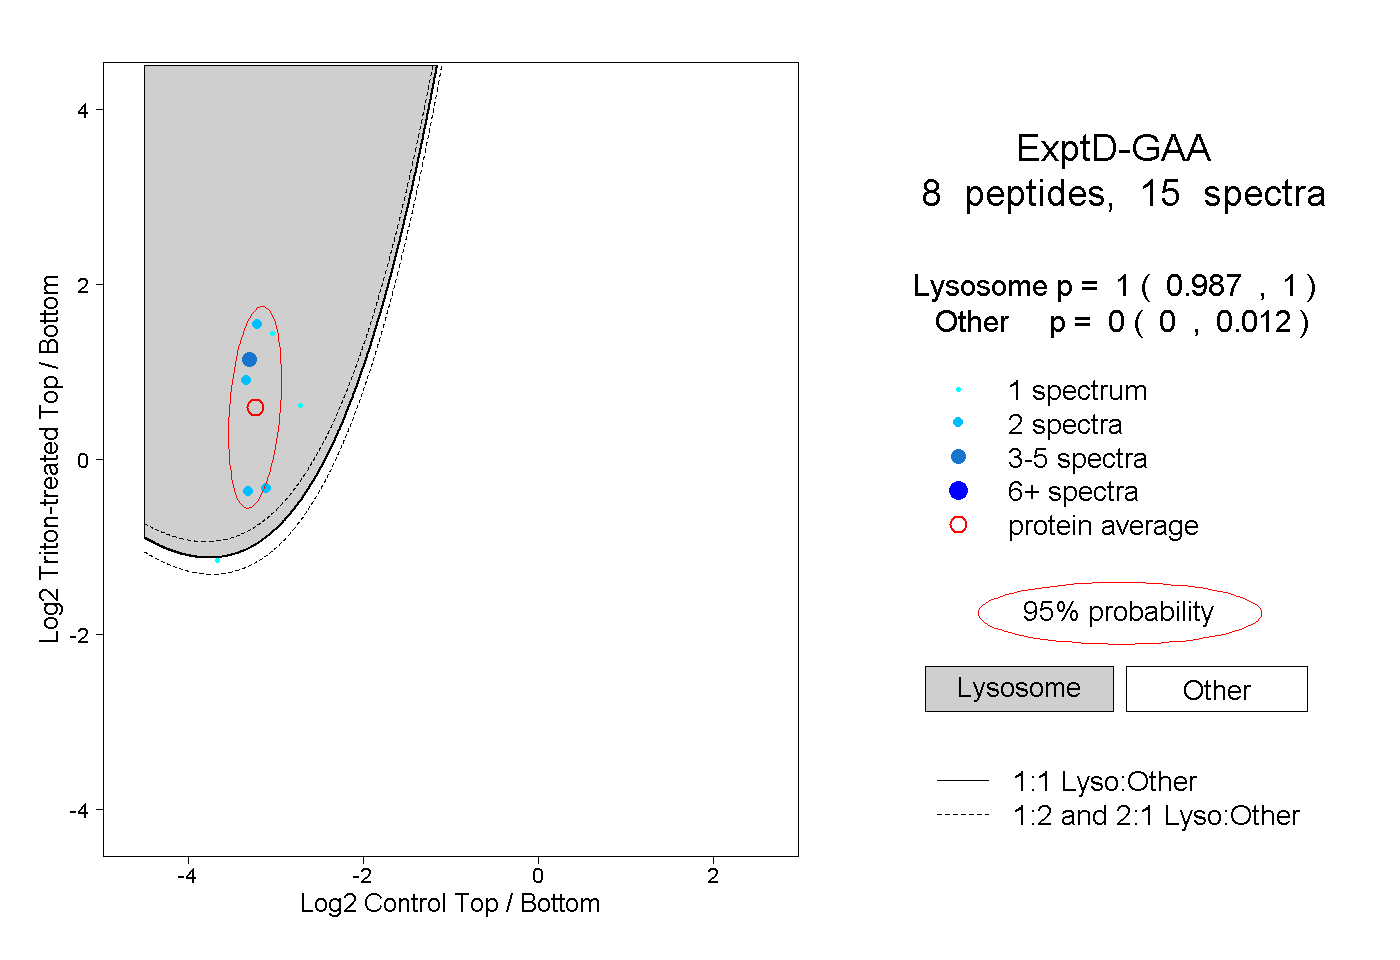 |
1.000 0.987 | 1.000 |
0.000 0.000 | 0.012 |