 1
1peptide
spectra
0.000 | 0.000
0.077 | 0.136
0.000 | 0.000
0.000 | 0.000
0.000 | 0.000
0.344 | 0.434
0.472 | 0.516
0.000 | 0.000
2peptides
spectra
0.000 | 0.999
0.001 | 1.000
| Plot | Mito | Lyso | Perox | ER | Golgi | PM | Cytosol | Nucleus | |||||
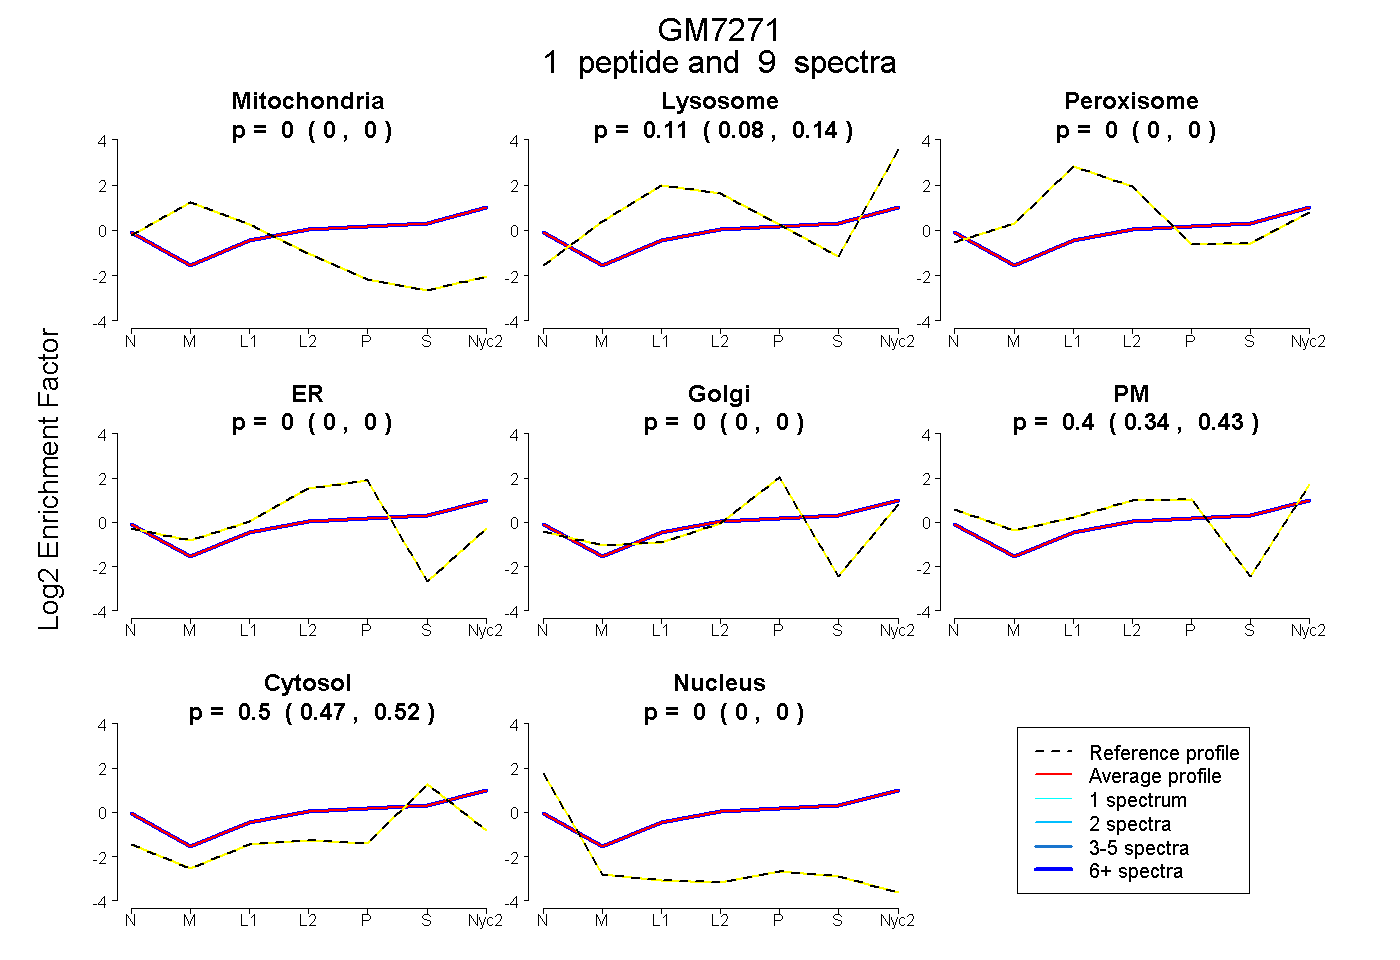
| Expt A |
1 peptide |
9 spectra |
|
0.000 0.000 | 0.000 |
0.109 0.077 | 0.136 |
0.000 0.000 | 0.000 |
0.000 0.000 | 0.000 |
0.000 0.000 | 0.000 |
0.396 0.344 | 0.434 |
0.495 0.472 | 0.516 |
0.000 0.000 | 0.000 |
||
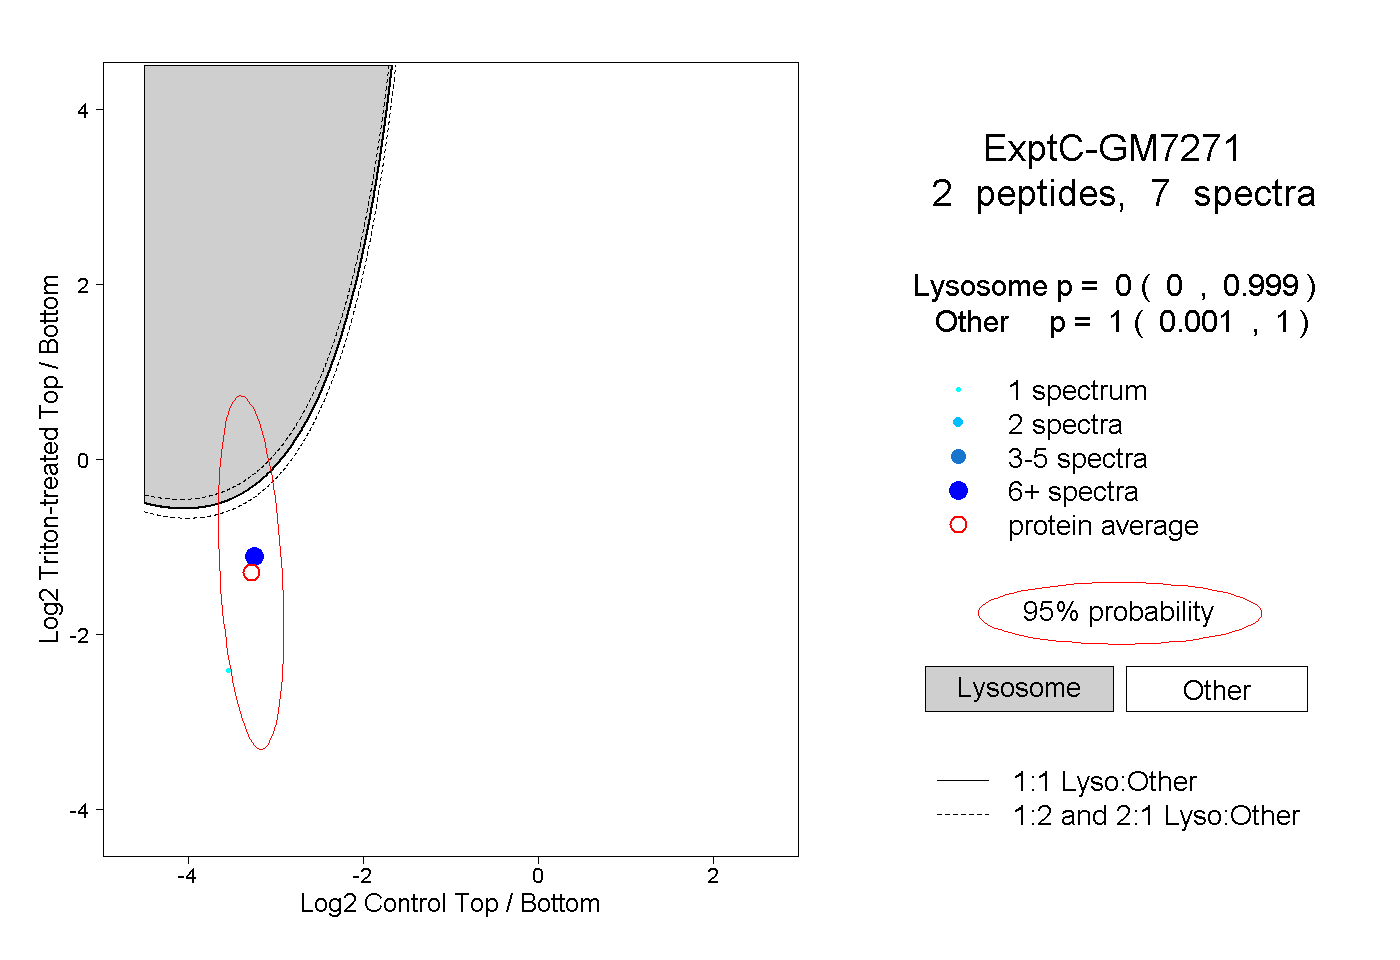
| Plot | Lyso | Other | |||||||||||
| Expt C |
2 peptides |
7 spectra |
|
0.000 0.000 | 0.999 |
1.000 0.001 | 1.000 |