3
3peptides
spectra
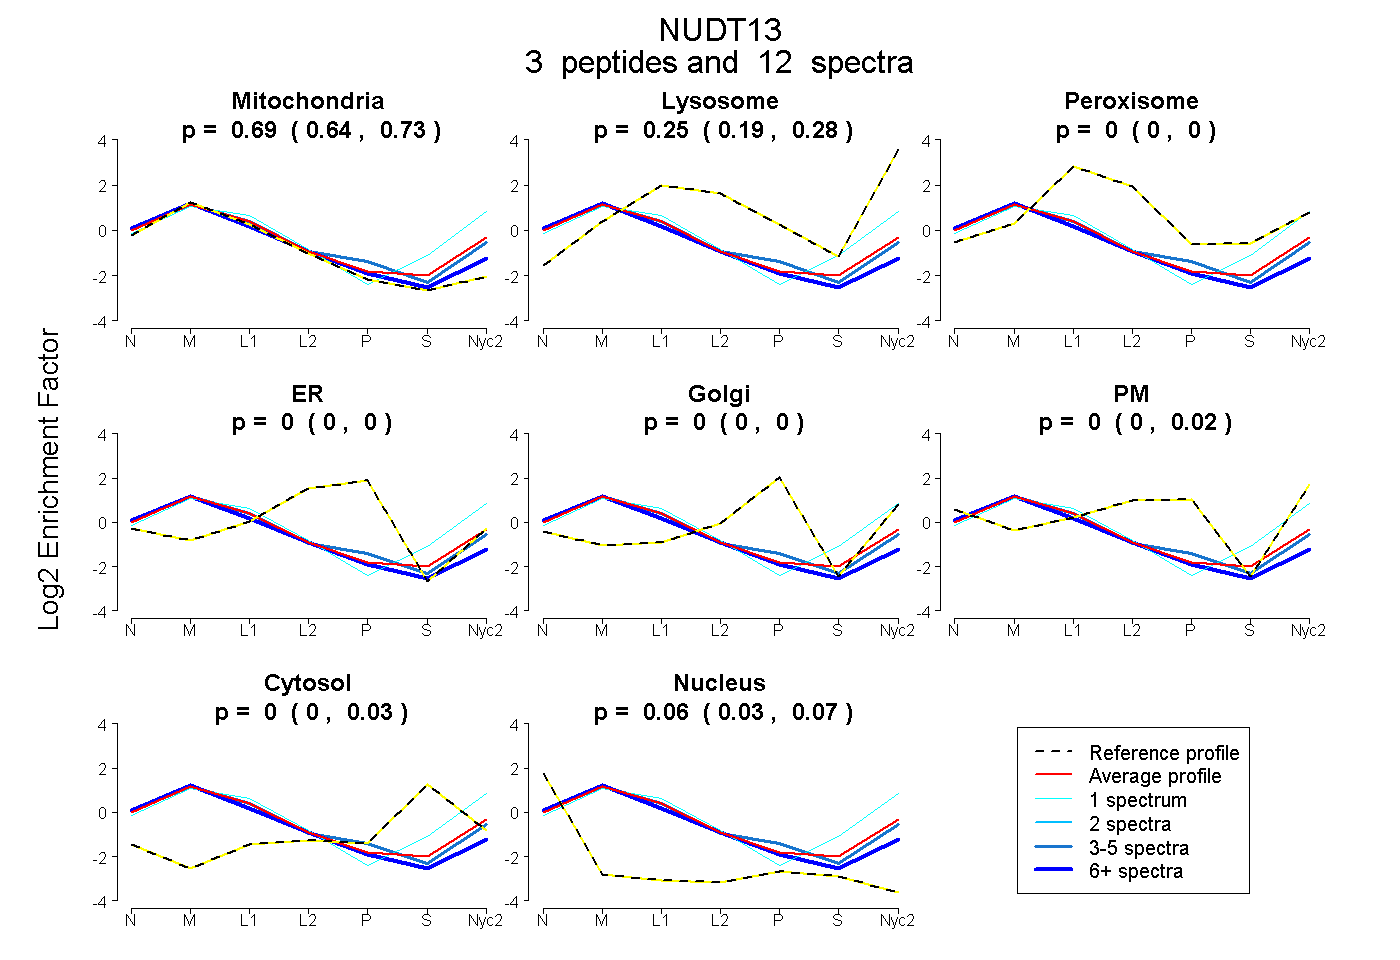
0.637 | 0.734
0.192 | 0.283
0.000 | 0.000
0.000 | 0.000
0.000 | 0.000
0.000 | 0.018
0.000 | 0.032
0.028 | 0.071
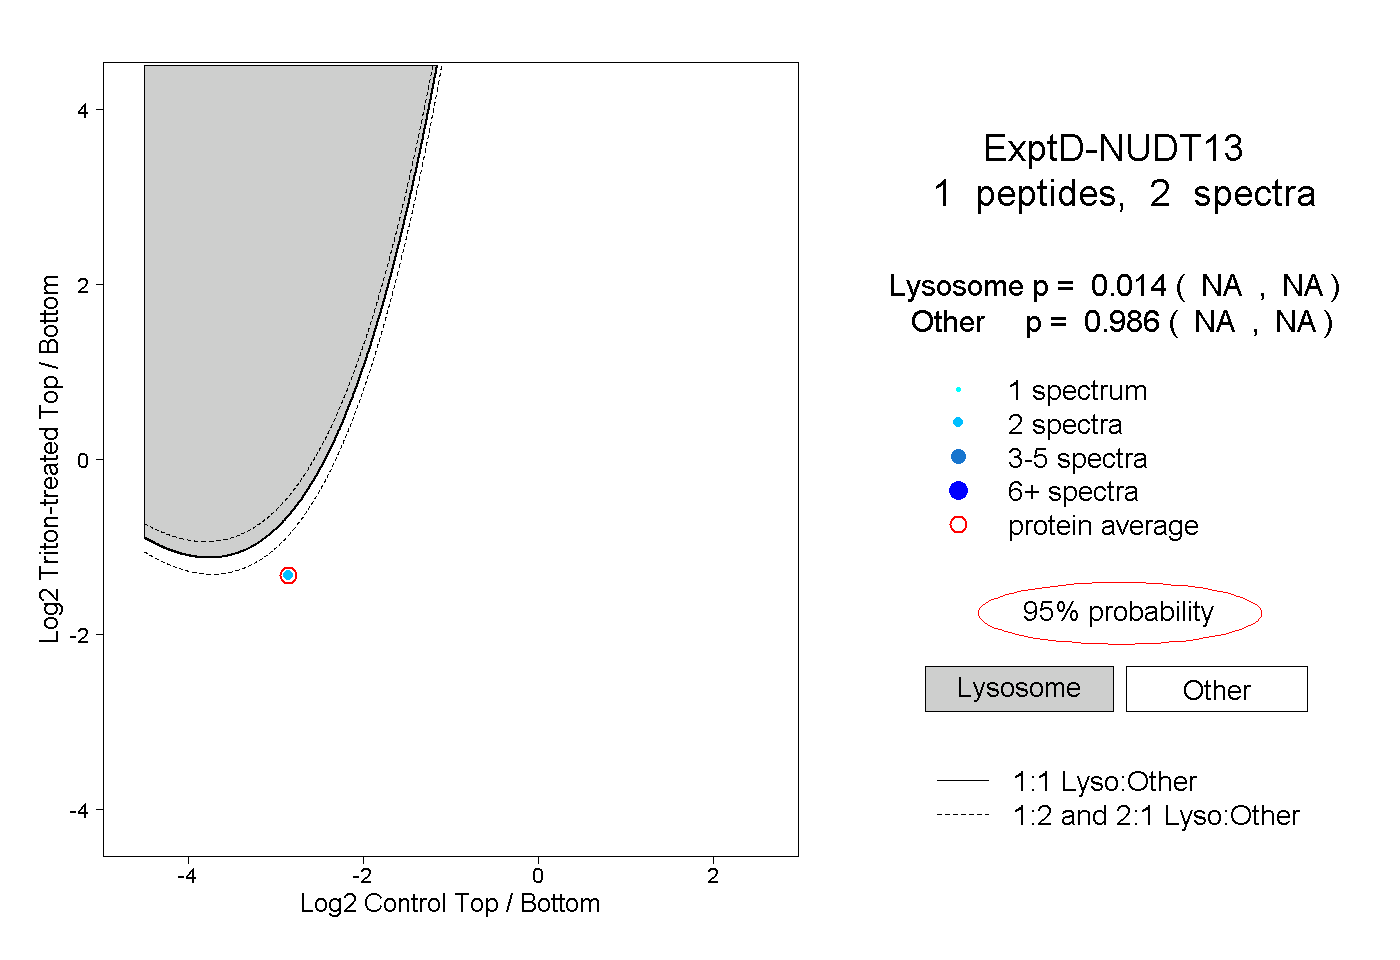
2peptides
spectra
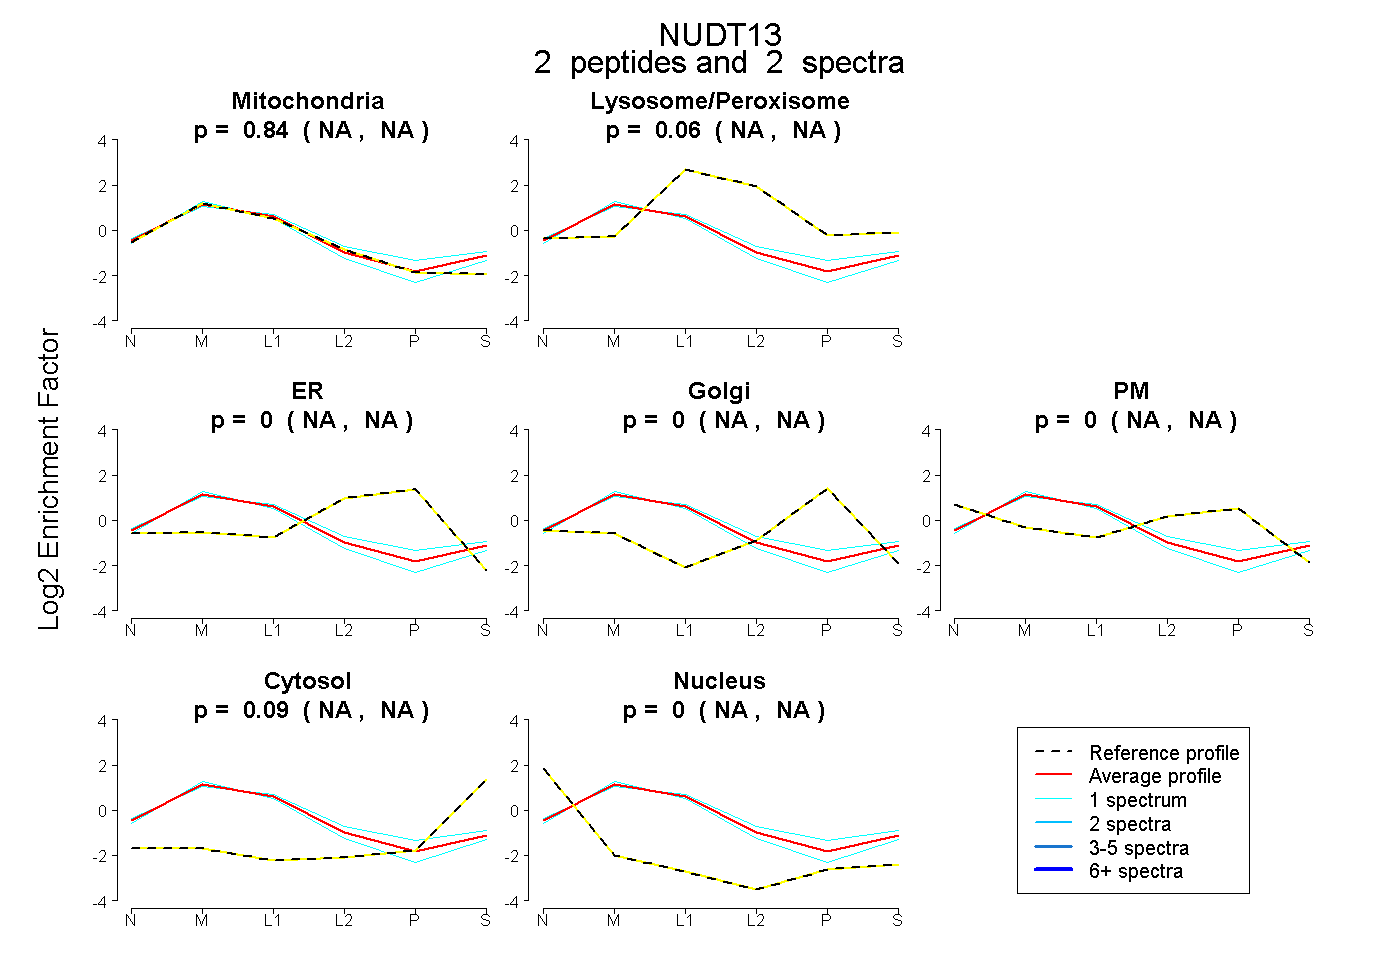
NA | NA
NA | NA
NA | NA
NA | NA
NA | NA
NA | NA
NA | NA
8peptides
spectra
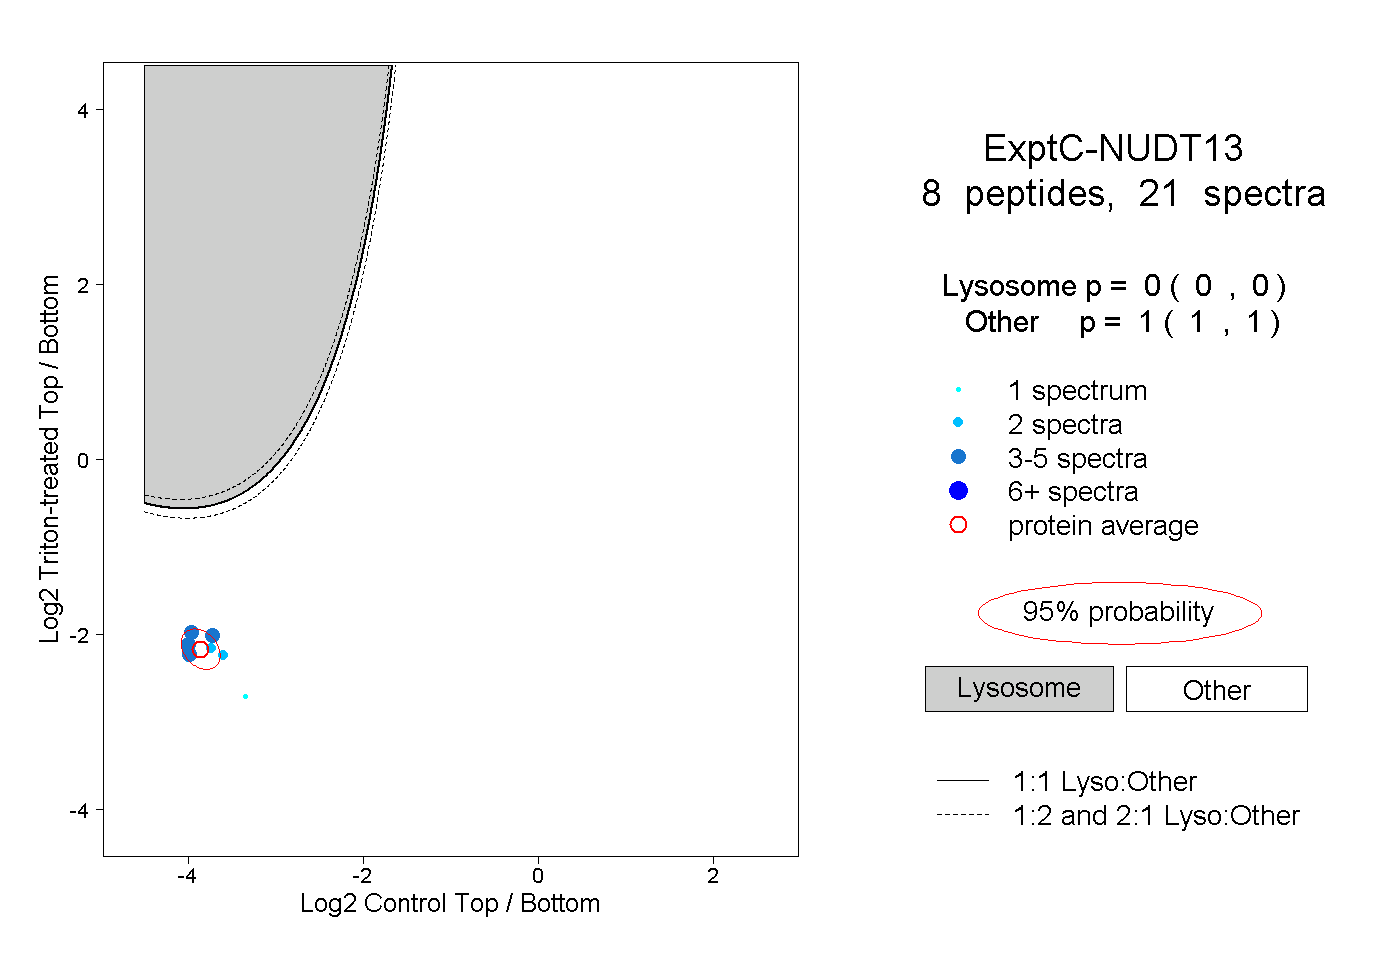
0.000 | 0.000
1.000 | 1.000