 3
3peptides
spectra
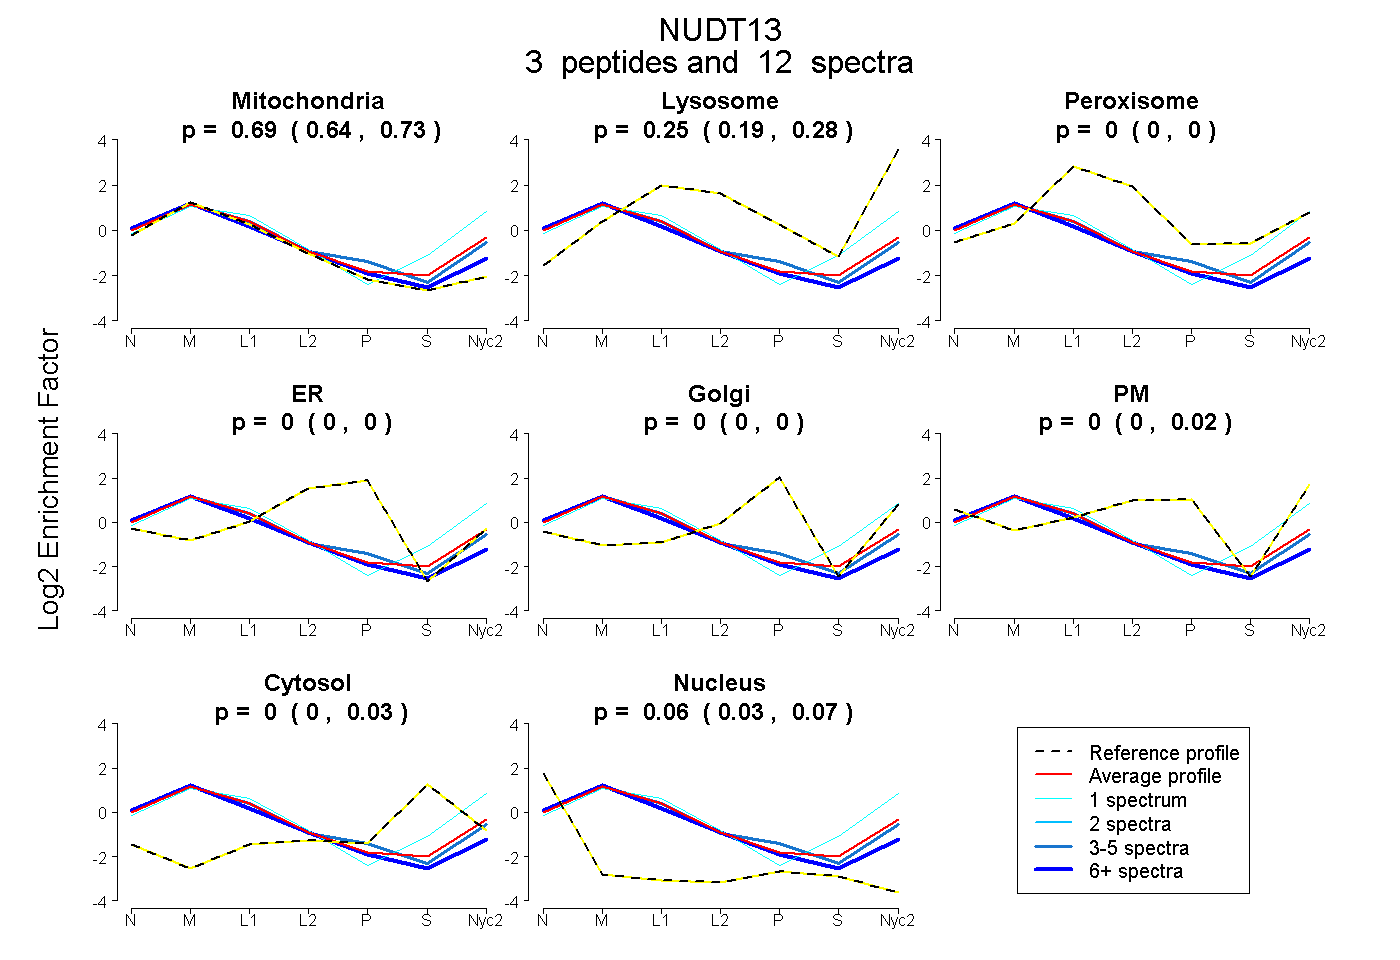
0.637 | 0.734
0.192 | 0.283
0.000 | 0.000
0.000 | 0.000
0.000 | 0.000
0.000 | 0.018
0.000 | 0.032
0.028 | 0.071
| Plot | Mito | Lyso | Perox | ER | Golgi | PM | Cytosol | Nucleus | |||||
| Expt A |
3 peptides |
12 spectra |
|
0.687 0.637 | 0.734 |
0.250 0.192 | 0.283 |
0.000 0.000 | 0.000 |
0.000 0.000 | 0.000 |
0.000 0.000 | 0.000 |
0.000 0.000 | 0.018 |
0.000 0.000 | 0.032 |
0.063 0.028 | 0.071 |
| 3 spectra, AELEGLLGK | 0.721 | 0.119 | 0.000 | 0.000 | 0.000 | 0.148 | 0.000 | 0.012 | ||
| 1 spectrum, GLYSALAGFCDIGER | 0.557 | 0.332 | 0.000 | 0.000 | 0.000 | 0.000 | 0.111 | 0.000 | ||
| 8 spectra, FGQDSQR | 0.848 | 0.025 | 0.000 | 0.000 | 0.000 | 0.117 | 0.000 | 0.010 |
| Plot | Mito | Lyso or Perox | ER | Golgi | PM | Cytosol | Nucleus | ||||||
| Expt B |
2 peptides |
2 spectra |
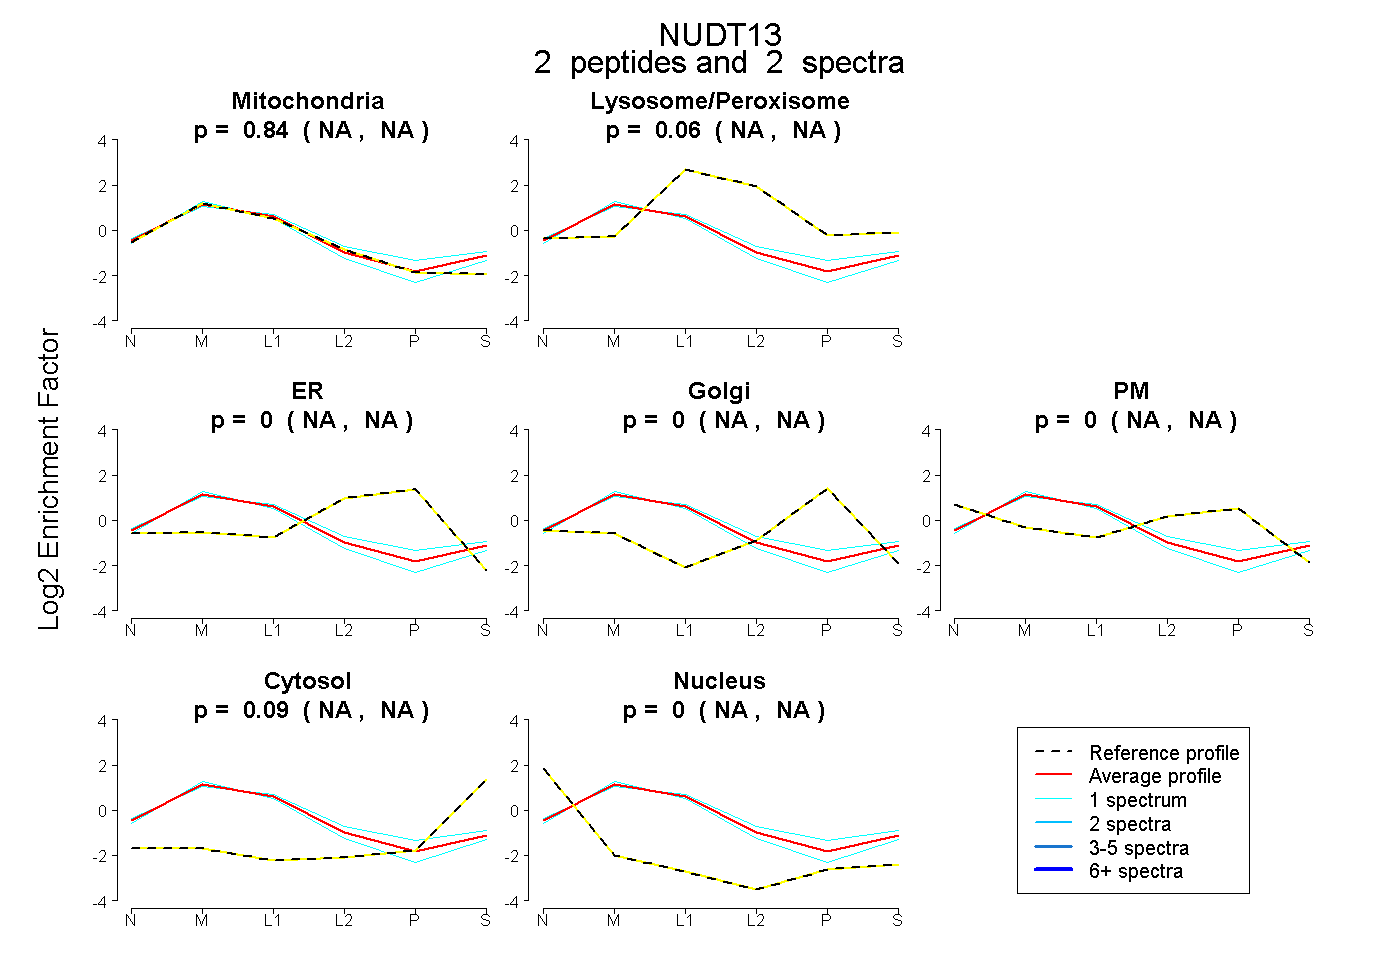 |
0.845 NA | NA |
0.065 NA | NA |
0.000 NA | NA |
0.000 NA | NA |
0.000 NA | NA |
0.091 NA | NA |
0.000 NA | NA |
|||
| Plot | Lyso | Other | |||||||||||
| Expt C |
8 peptides |
21 spectra |
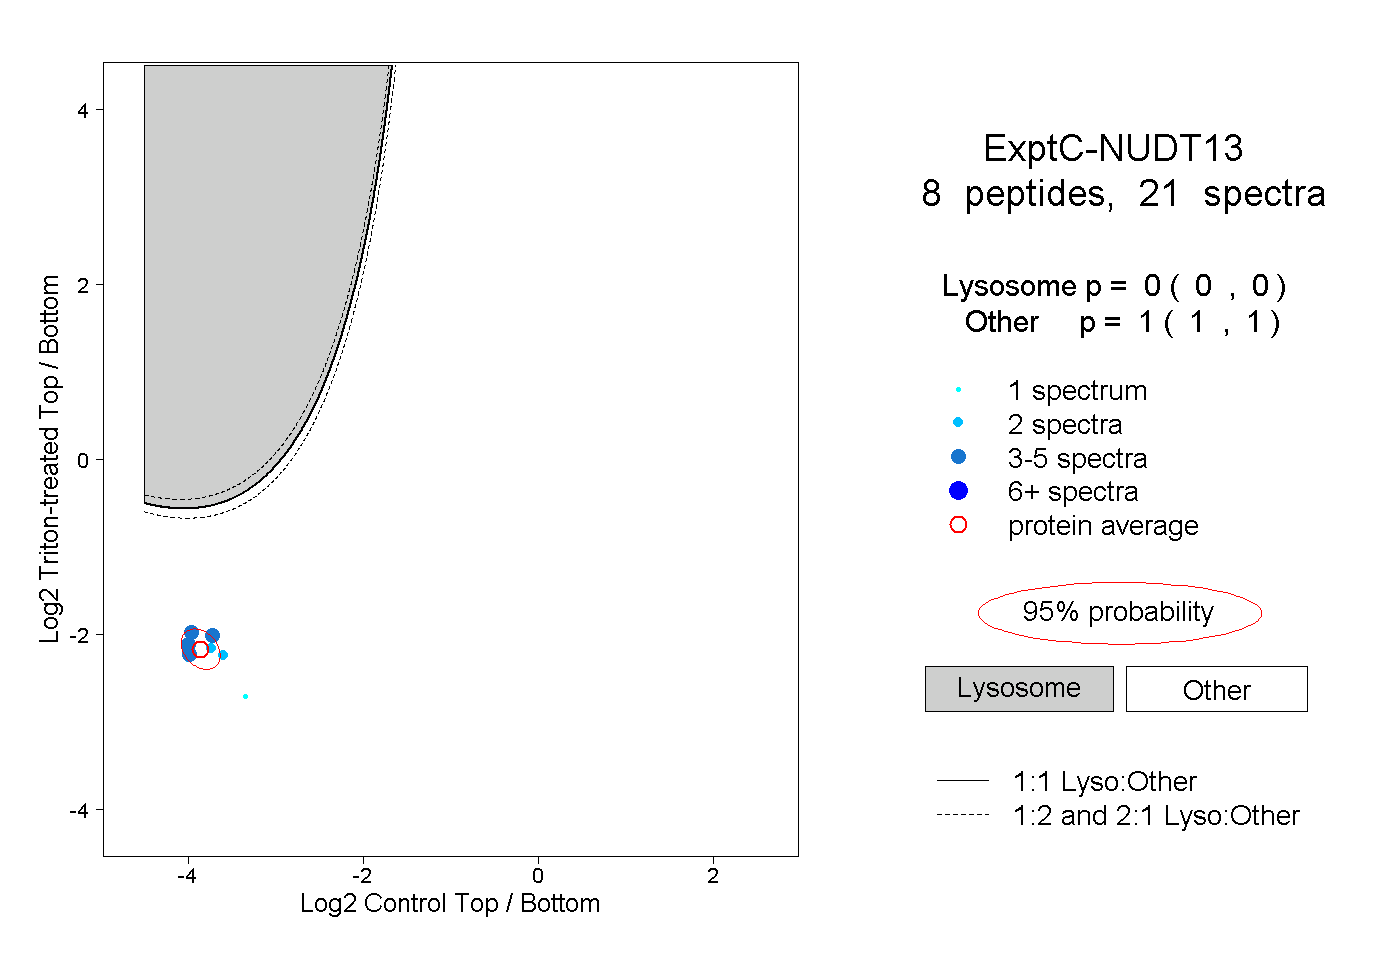 |
0.000 0.000 | 0.000 |
1.000 1.000 | 1.000 |
||||||||
| Plot | Lyso | Other | |||||||||||
| Expt D |
1 peptide |
2 spectra |
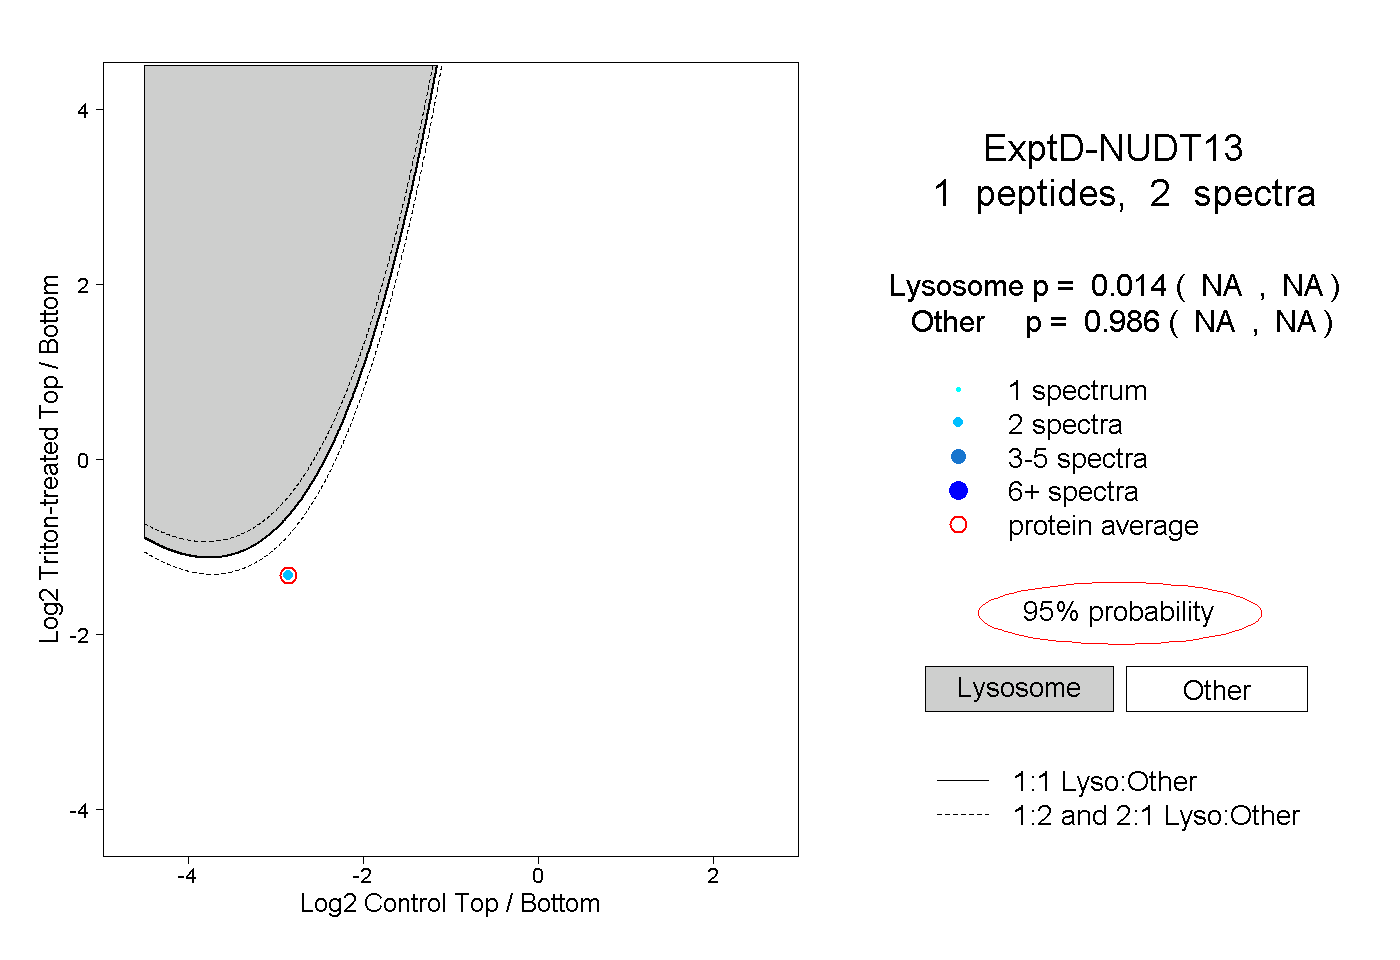 |
0.014 NA | NA |
0.986 NA | NA |