 7
7peptides
spectra
0.000 | 0.055
0.000 | 0.015
0.001 | 0.072
0.000 | 0.046
0.000 | 0.000
0.846 | 0.921
0.000 | 0.046
0.000 | 0.023
6peptides
spectra
0.000 | 0.000
1.000 | 1.000
| Plot | Mito | Lyso | Perox | ER | Golgi | PM | Cytosol | Nucleus | |||||
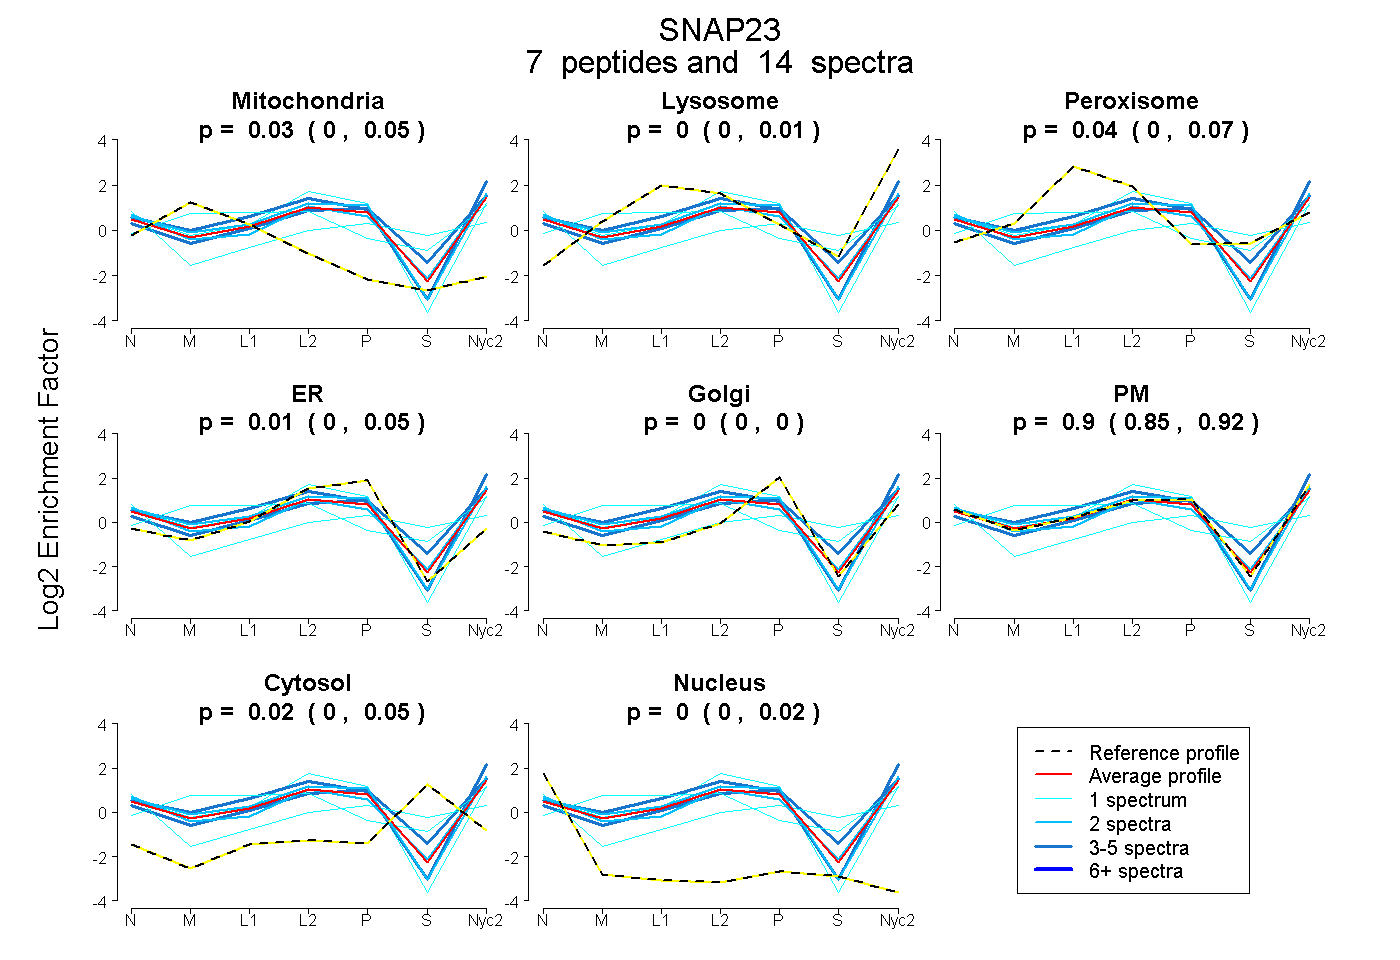
| Expt A |
7 peptides |
14 spectra |
|
0.030 0.000 | 0.055 |
0.000 0.000 | 0.015 |
0.039 0.001 | 0.072 |
0.012 0.000 | 0.046 |
0.000 0.000 | 0.000 |
0.896 0.846 | 0.921 |
0.023 0.000 | 0.046 |
0.000 0.000 | 0.023 |
||
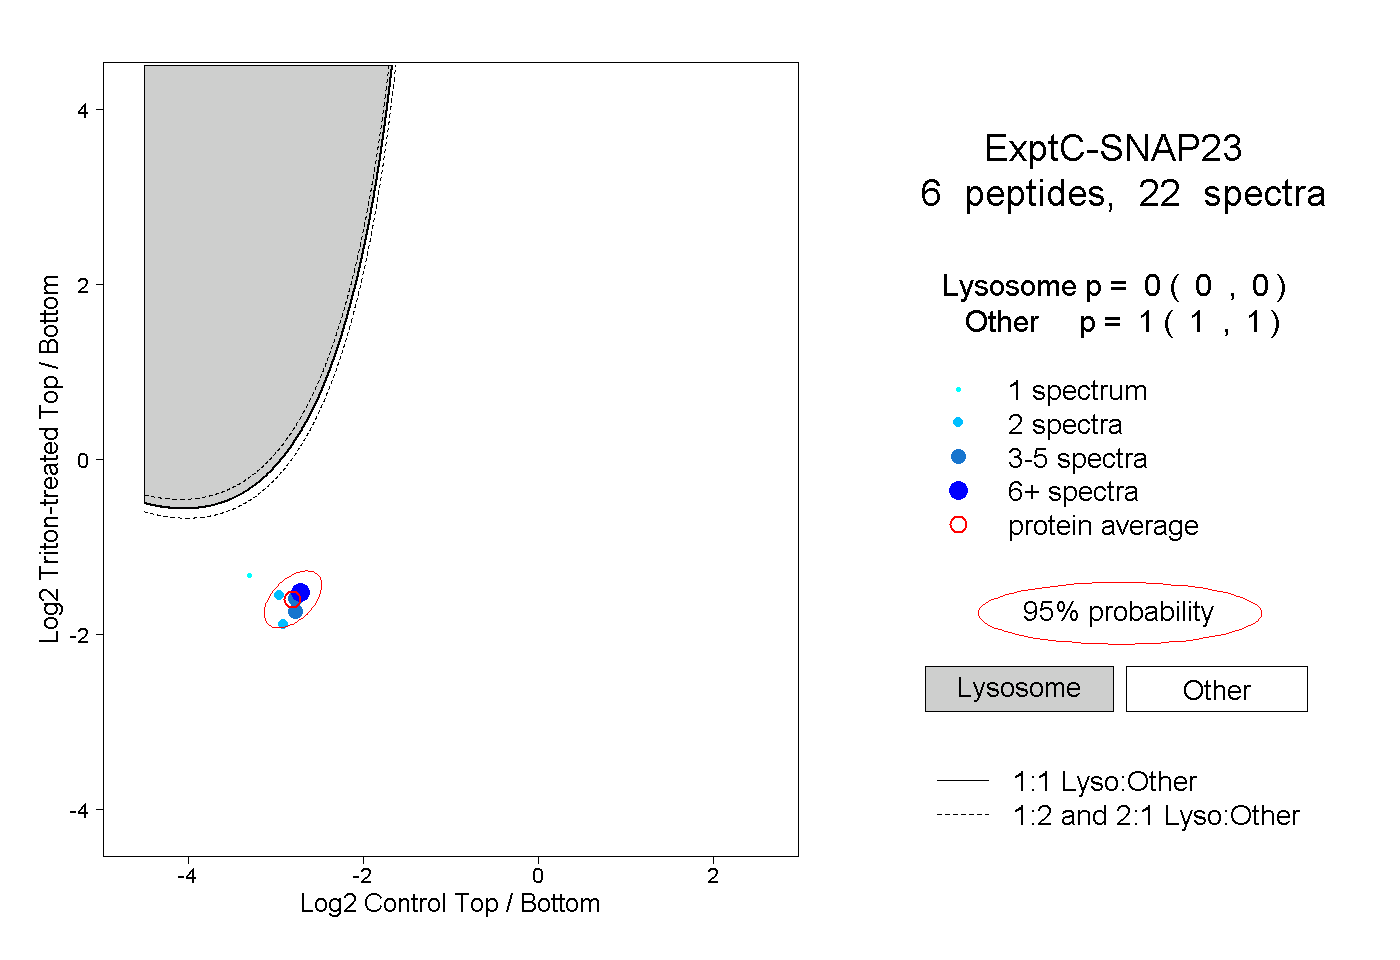
| Plot | Lyso | Other | |||||||||||
| Expt C |
6 peptides |
22 spectra |
|
0.000 0.000 | 0.000 |
1.000 1.000 | 1.000 |