 2
2peptides
spectra
0.017 | 0.155
0.000 | 0.000
0.000 | 0.018
0.000 | 0.000
0.000 | 0.029
0.393 | 0.590
0.109 | 0.434
0.001 | 0.179
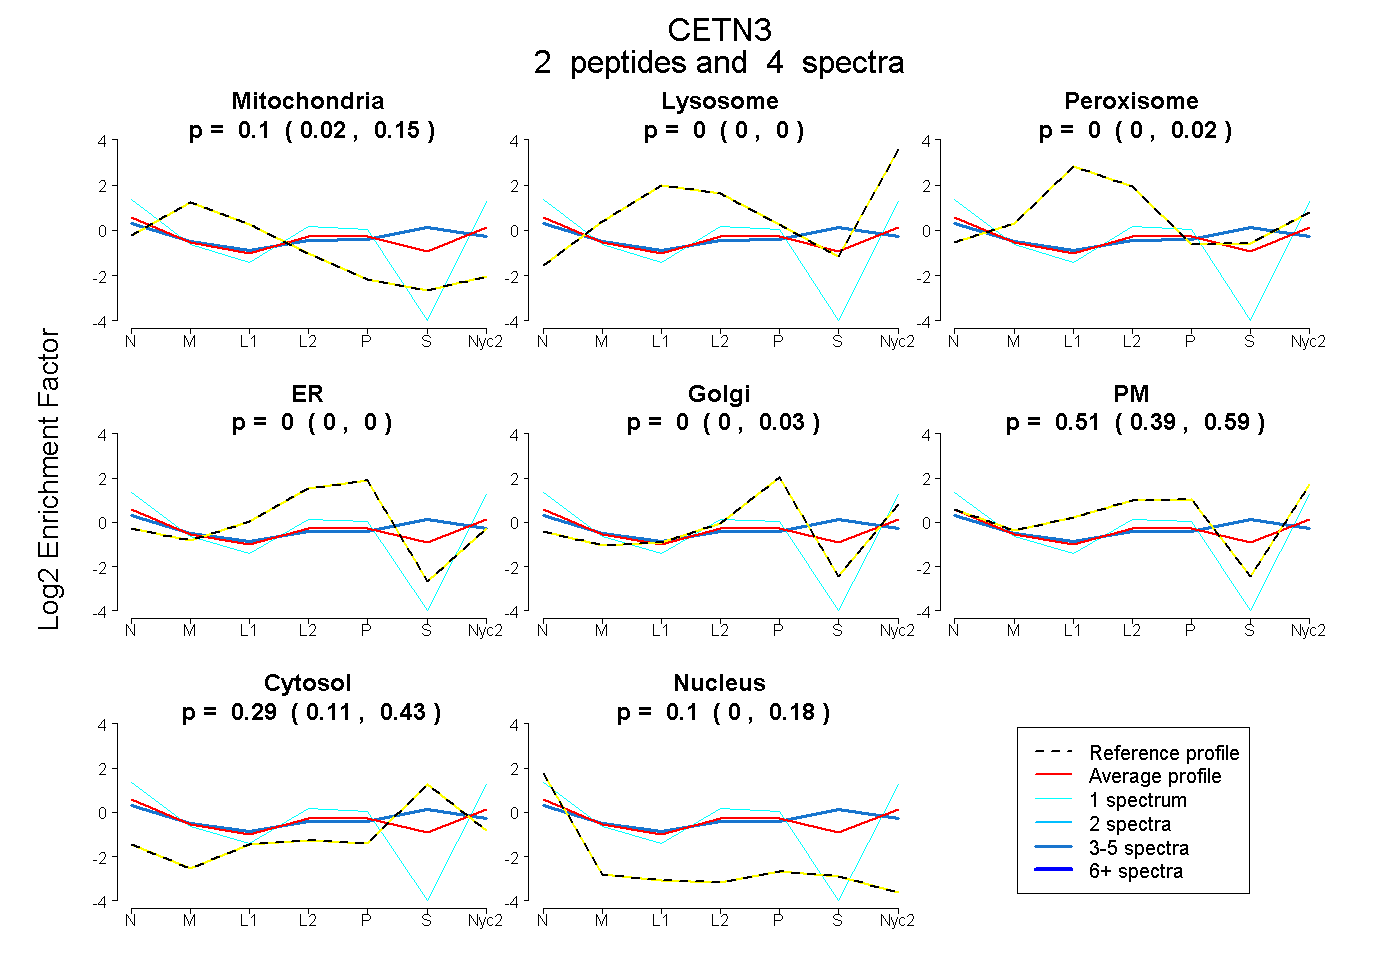
| Plot | Mito | Lyso | Perox | ER | Golgi | PM | Cytosol | Nucleus | |||||
| Expt A |
2 peptides |
4 spectra |
|
0.096 0.017 | 0.155 |
0.000 0.000 | 0.000 |
0.000 0.000 | 0.018 |
0.000 0.000 | 0.000 |
0.000 0.000 | 0.029 |
0.511 0.393 | 0.590 |
0.294 0.109 | 0.434 |
0.099 0.001 | 0.179 |