 22
22peptides
spectra
0.948 | 0.953
0.000 | 0.000
0.000 | 0.000
0.000 | 0.000
0.000 | 0.000
0.000 | 0.000
0.000 | 0.000
0.046 | 0.052
| Plot | Mito | Lyso | Perox | ER | Golgi | PM | Cytosol | Nucleus | |||||
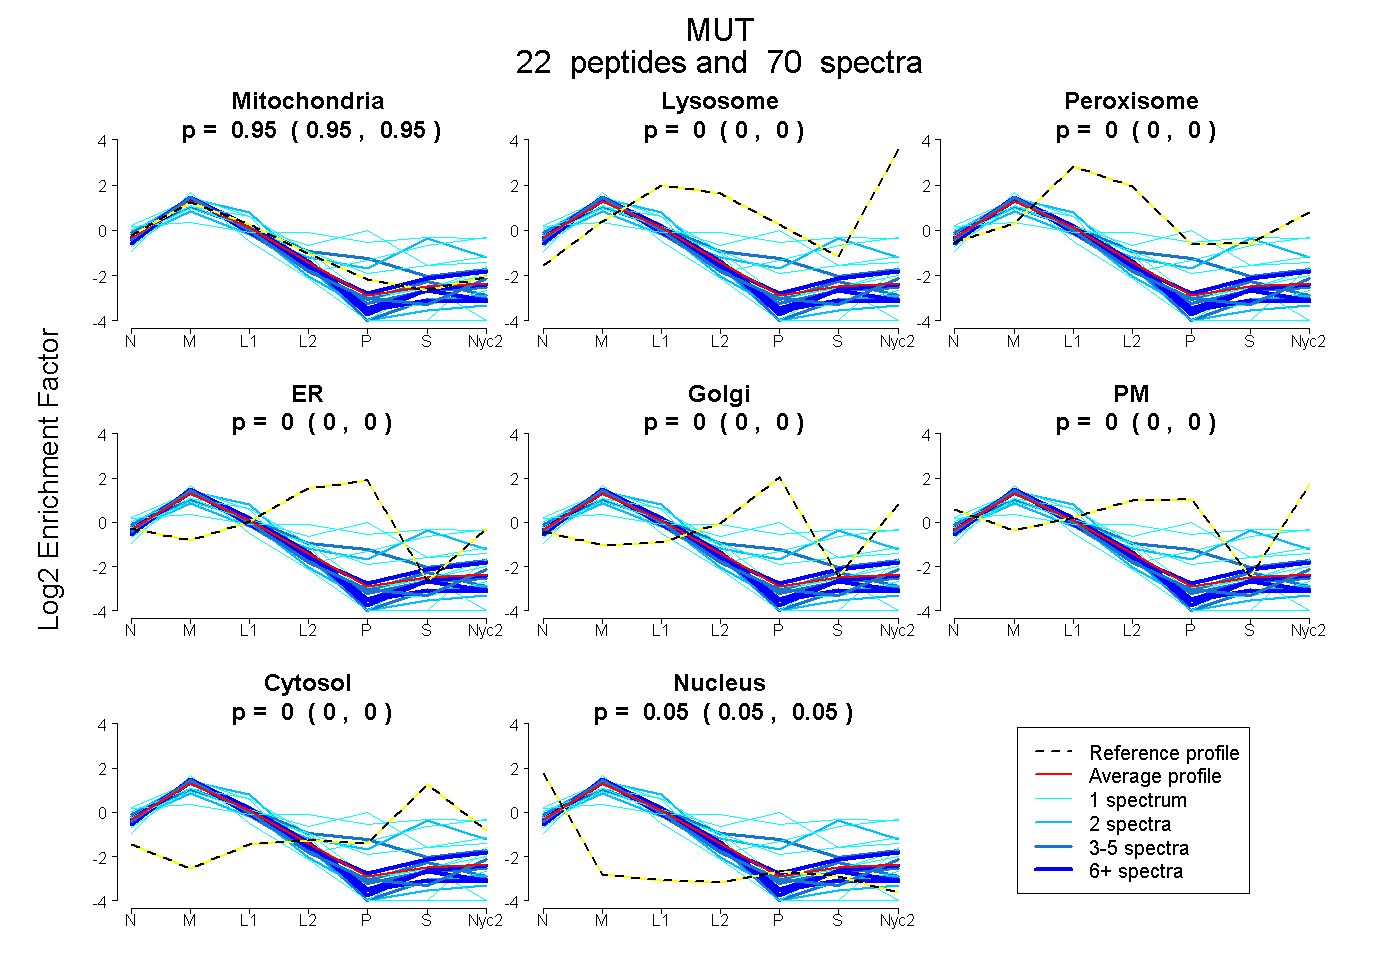
| Expt A |
22 peptides |
70 spectra |
|
0.951 0.948 | 0.953 |
0.000 0.000 | 0.000 |
0.000 0.000 | 0.000 |
0.000 0.000 | 0.000 |
0.000 0.000 | 0.000 |
0.000 0.000 | 0.000 |
0.000 0.000 | 0.000 |
0.049 0.046 | 0.052 |
| 8 spectra, MVSGAYR | 0.942 | 0.000 | 0.000 | 0.000 | 0.000 | 0.000 | 0.058 | 0.000 | ||
| 1 spectrum, LTGTIQNDILK | 0.841 | 0.000 | 0.000 | 0.000 | 0.000 | 0.000 | 0.000 | 0.159 | ||
| 8 spectra, LWAHLIEK | 0.912 | 0.000 | 0.000 | 0.000 | 0.000 | 0.000 | 0.000 | 0.088 | ||
| 1 spectrum, EDSVEVLAIDNTSVR | 0.960 | 0.000 | 0.000 | 0.000 | 0.000 | 0.000 | 0.000 | 0.040 | ||
| 1 spectrum, IIADIFQYTAQHMPK | 0.995 | 0.000 | 0.000 | 0.000 | 0.000 | 0.000 | 0.000 | 0.005 | ||
| 1 spectrum, GPYPTMYTYRPWTIR | 0.910 | 0.000 | 0.000 | 0.000 | 0.000 | 0.000 | 0.000 | 0.090 | ||
| 1 spectrum, EVAQQAVDADVHAVGVSTLAAGHK | 0.565 | 0.168 | 0.000 | 0.000 | 0.000 | 0.000 | 0.267 | 0.000 | ||
| 3 spectra, QYAGFSTVEESNK | 0.944 | 0.000 | 0.000 | 0.000 | 0.000 | 0.000 | 0.000 | 0.056 | ||
| 2 spectra, DQAIAER | 0.583 | 0.010 | 0.080 | 0.000 | 0.000 | 0.000 | 0.327 | 0.000 | ||
| 6 spectra, MGQDGHDR | 0.979 | 0.000 | 0.000 | 0.000 | 0.000 | 0.000 | 0.000 | 0.021 | ||
| 1 spectrum, VFGEHK | 0.563 | 0.000 | 0.067 | 0.105 | 0.212 | 0.000 | 0.053 | 0.000 | ||
| 2 spectra, ADTMDLPEELPGVKPFTR | 0.945 | 0.000 | 0.000 | 0.000 | 0.000 | 0.000 | 0.000 | 0.055 | ||
| 1 spectrum, IDSGSEVIVGVNK | 0.935 | 0.000 | 0.000 | 0.000 | 0.000 | 0.000 | 0.000 | 0.065 | ||
| 4 spectra, AGQQGLSVAFDLATHR | 0.789 | 0.000 | 0.032 | 0.017 | 0.111 | 0.000 | 0.051 | 0.000 | ||
| 3 spectra, IEECAAR | 0.924 | 0.000 | 0.000 | 0.000 | 0.000 | 0.000 | 0.000 | 0.076 | ||
| 2 spectra, ILFDGIPLEK | 0.888 | 0.000 | 0.000 | 0.000 | 0.000 | 0.000 | 0.000 | 0.112 | ||
| 4 spectra, GYDSDNPR | 0.909 | 0.000 | 0.000 | 0.000 | 0.000 | 0.000 | 0.000 | 0.091 | ||
| 1 spectrum, NTYIFPPEPSMK | 0.743 | 0.017 | 0.152 | 0.000 | 0.000 | 0.000 | 0.088 | 0.000 | ||
| 3 spectra, GDVGMAGVAIDTVEDTK | 0.929 | 0.000 | 0.000 | 0.000 | 0.000 | 0.000 | 0.000 | 0.071 | ||
| 15 spectra, LIYEVEEMGGMAK | 0.932 | 0.000 | 0.000 | 0.000 | 0.000 | 0.000 | 0.000 | 0.068 | ||
| 1 spectrum, TLVPELIK | 0.283 | 0.000 | 0.177 | 0.000 | 0.000 | 0.247 | 0.294 | 0.000 | ||
| 1 spectrum, EITSAIK | 0.964 | 0.000 | 0.000 | 0.000 | 0.000 | 0.000 | 0.000 | 0.036 |
| Plot | Mito | Lyso or Perox | ER | Golgi | PM | Cytosol | Nucleus | ||||||
| Expt B |
13 peptides |
38 spectra |
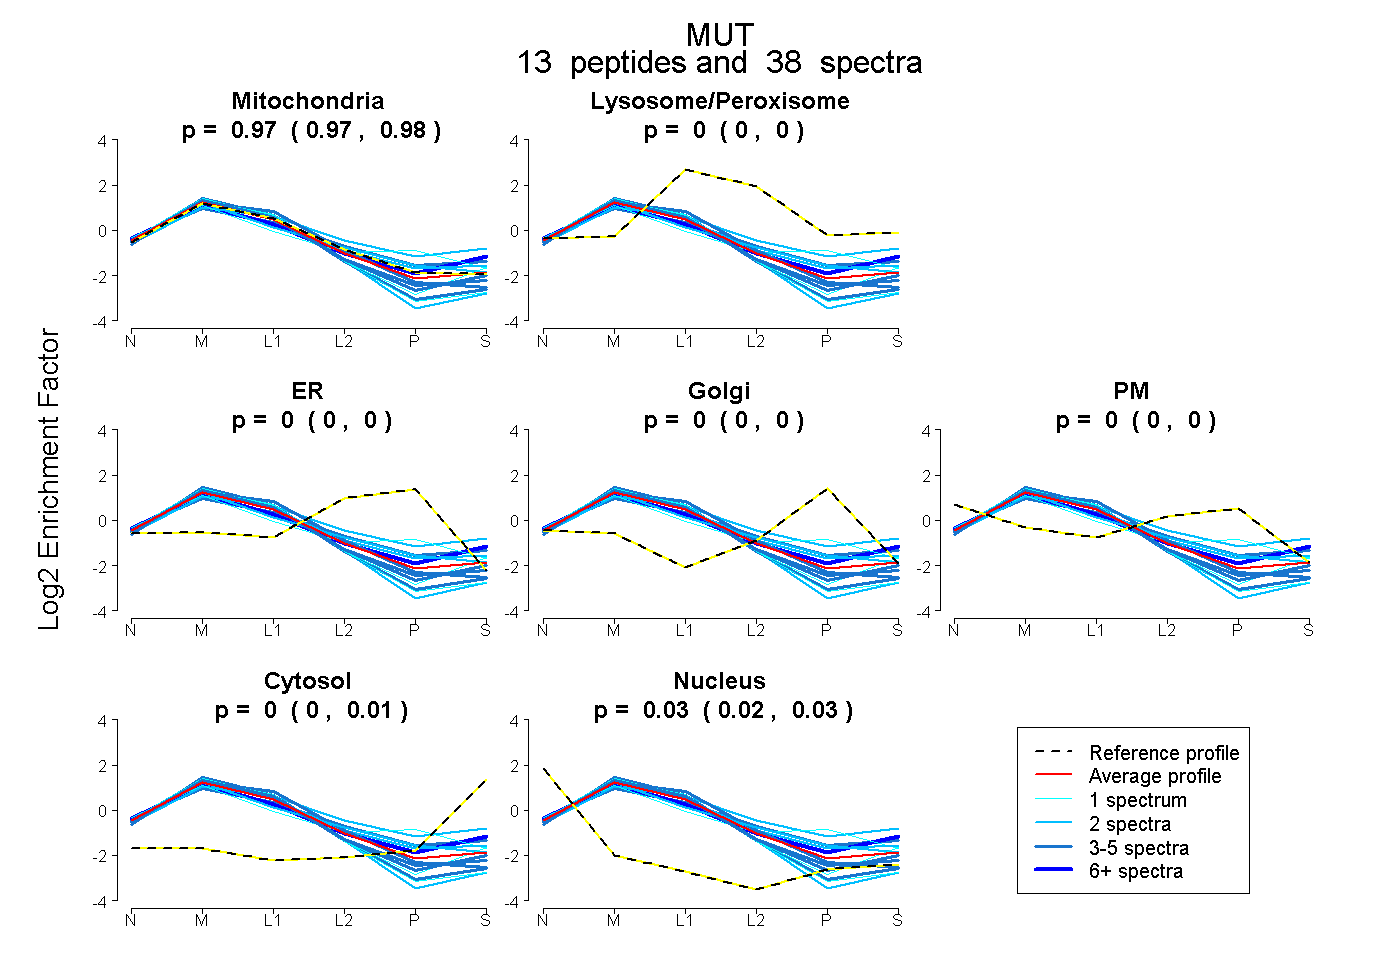 |
0.974 0.969 | 0.977 |
0.000 0.000 | 0.000 |
0.000 0.000 | 0.000 |
0.000 0.000 | 0.000 |
0.000 0.000 | 0.000 |
0.000 0.000 | 0.007 |
0.026 0.020 | 0.029 |
|||
| Plot | Lyso | Other | |||||||||||
| Expt C |
27 peptides |
270 spectra |
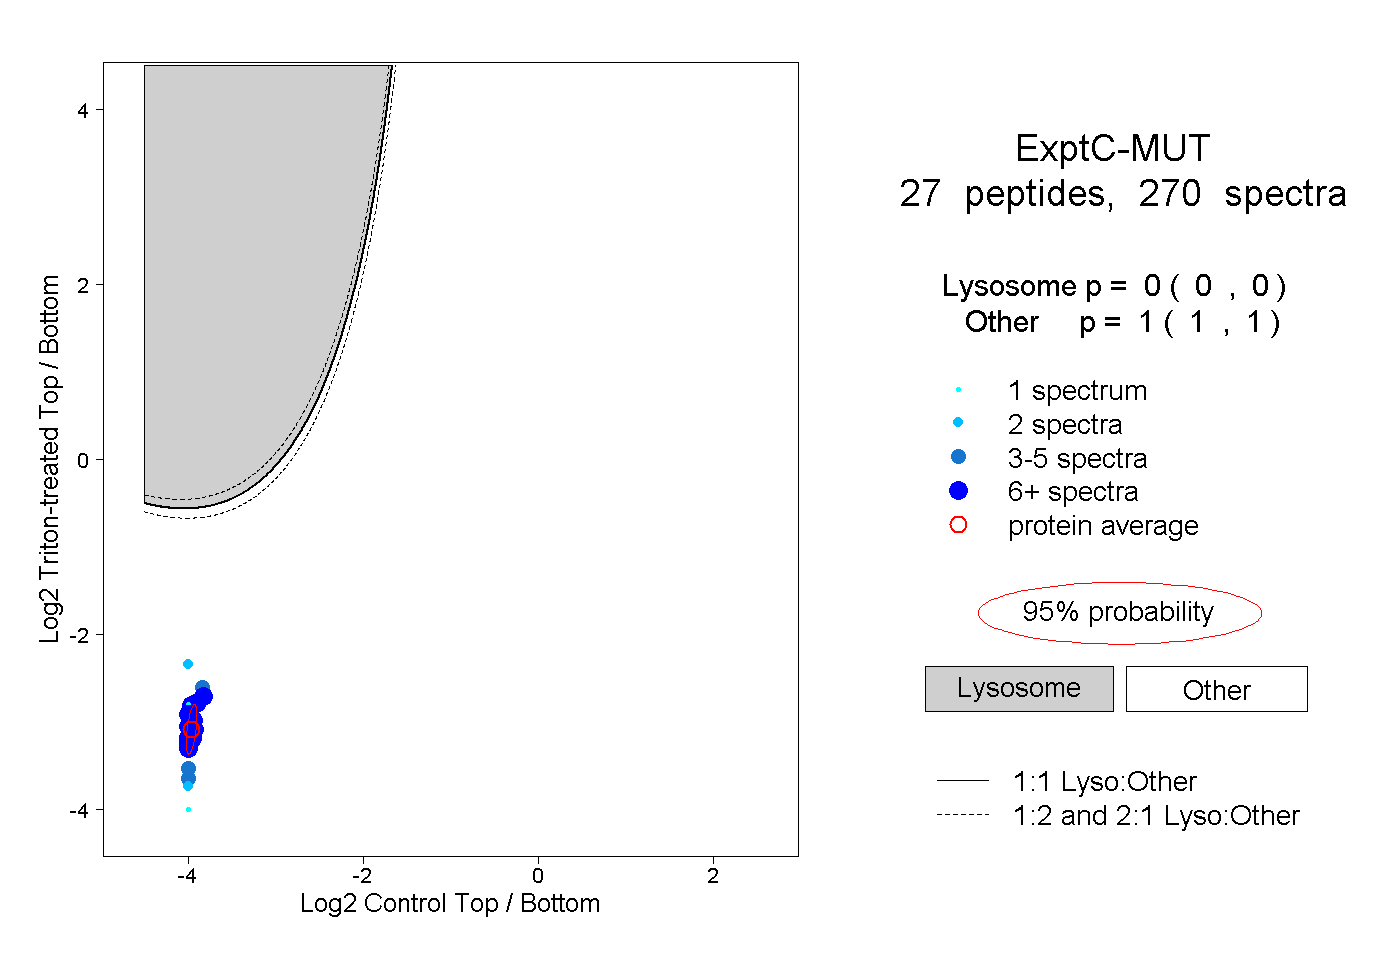 |
0.000 0.000 | 0.000 |
1.000 1.000 | 1.000 |
||||||||
| Plot | Lyso | Other | |||||||||||
| Expt D |
15 peptides |
27 spectra |
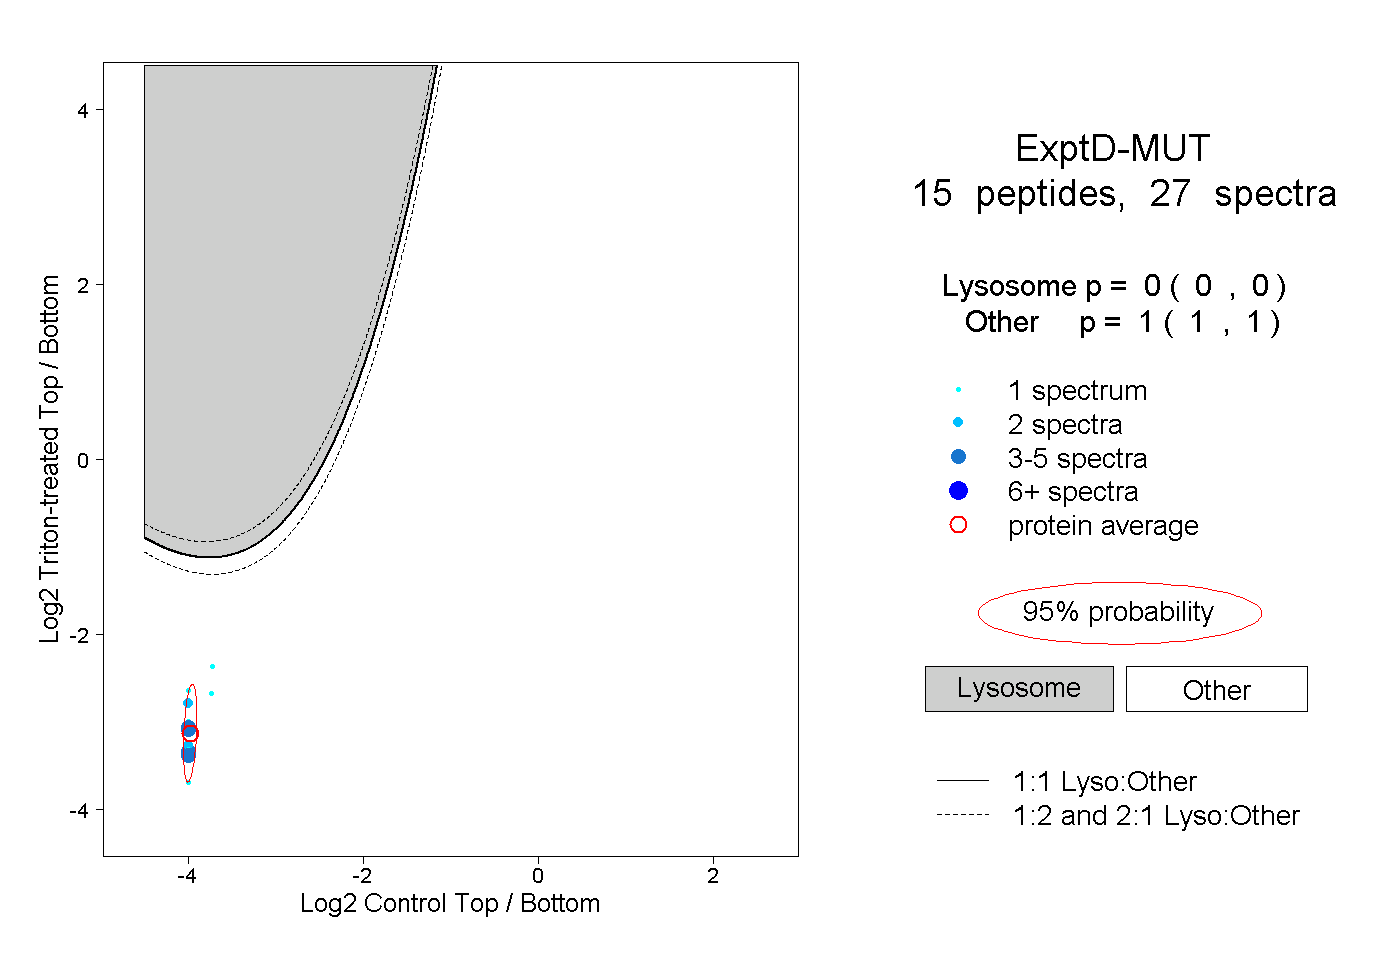 |
0.000 0.000 | 0.000 |
1.000 1.000 | 1.000 |