 3
3peptides
spectra
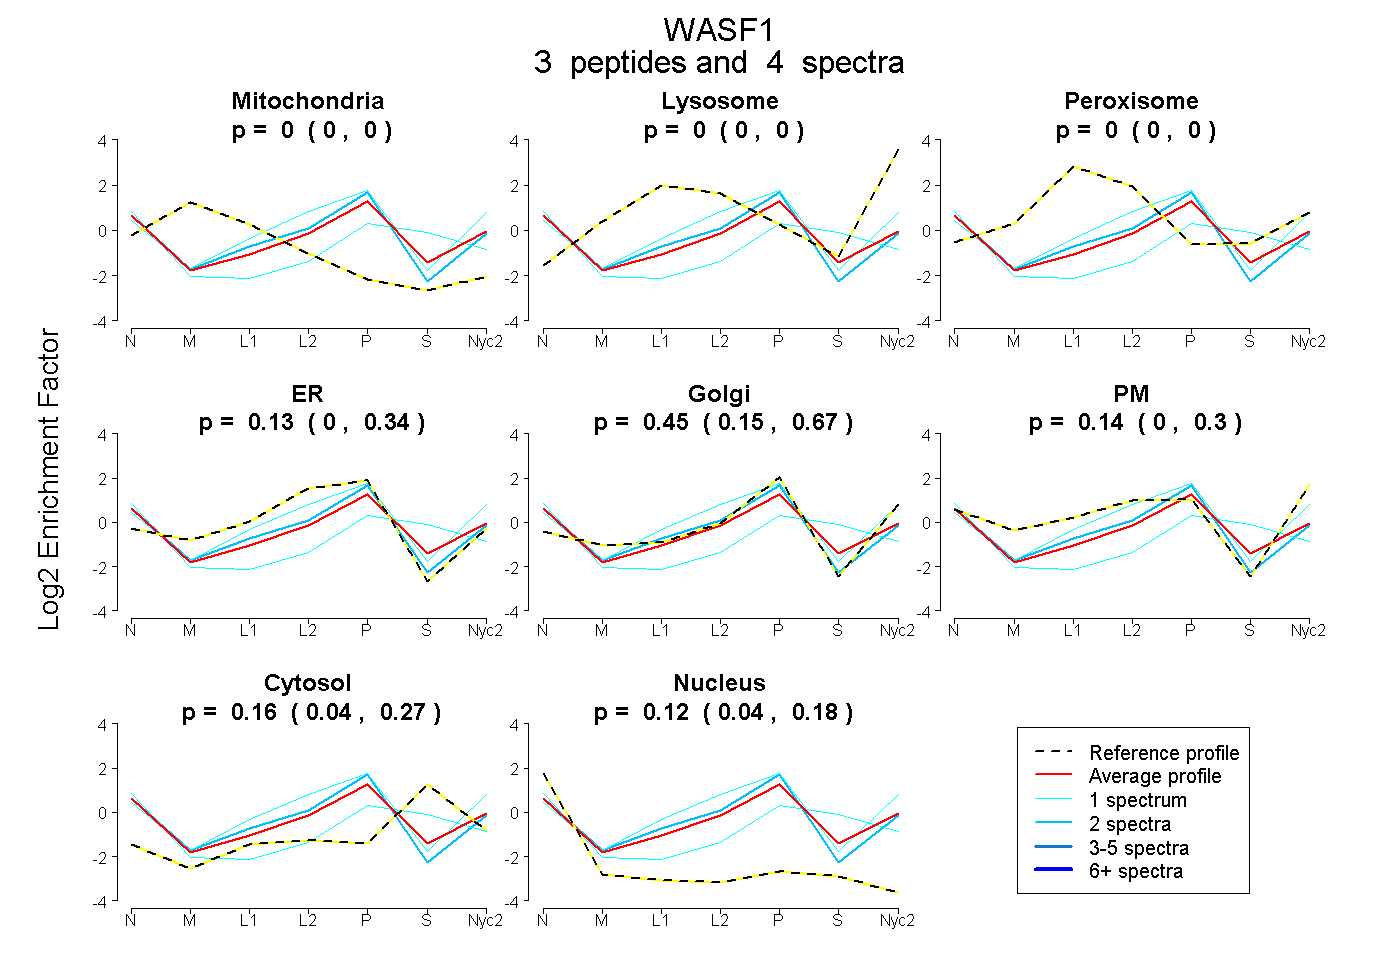
0.000 | 0.000
0.000 | 0.000
0.000 | 0.000
0.000 | 0.336
0.147 | 0.673
0.000 | 0.300
0.038 | 0.266
0.043 | 0.181
2peptides
spectra
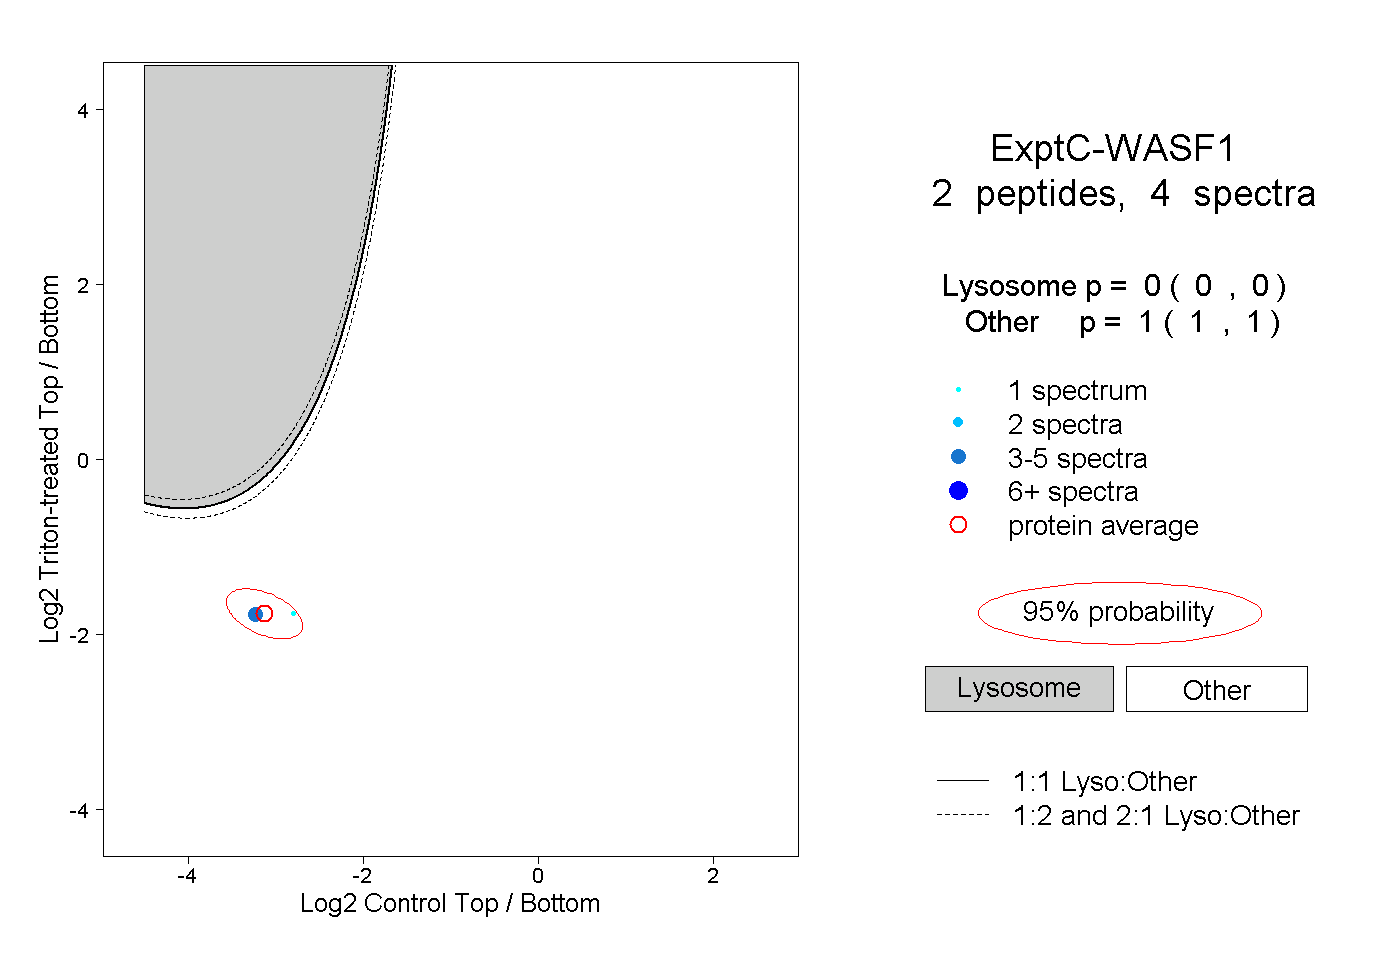
0.000 | 0.000
1.000 | 1.000
| Plot | Mito | Lyso | Perox | ER | Golgi | PM | Cytosol | Nucleus | |||||
| Expt A |
3 peptides |
4 spectra |
|
0.000 0.000 | 0.000 |
0.000 0.000 | 0.000 |
0.000 0.000 | 0.000 |
0.131 0.000 | 0.336 |
0.447 0.147 | 0.673 |
0.140 0.000 | 0.300 |
0.161 0.038 | 0.266 |
0.120 0.043 | 0.181 |
||
| Plot | Lyso | Other | |||||||||||
| Expt C |
2 peptides |
4 spectra |
|
0.000 0.000 | 0.000 |
1.000 1.000 | 1.000 |