9
9peptides
spectra
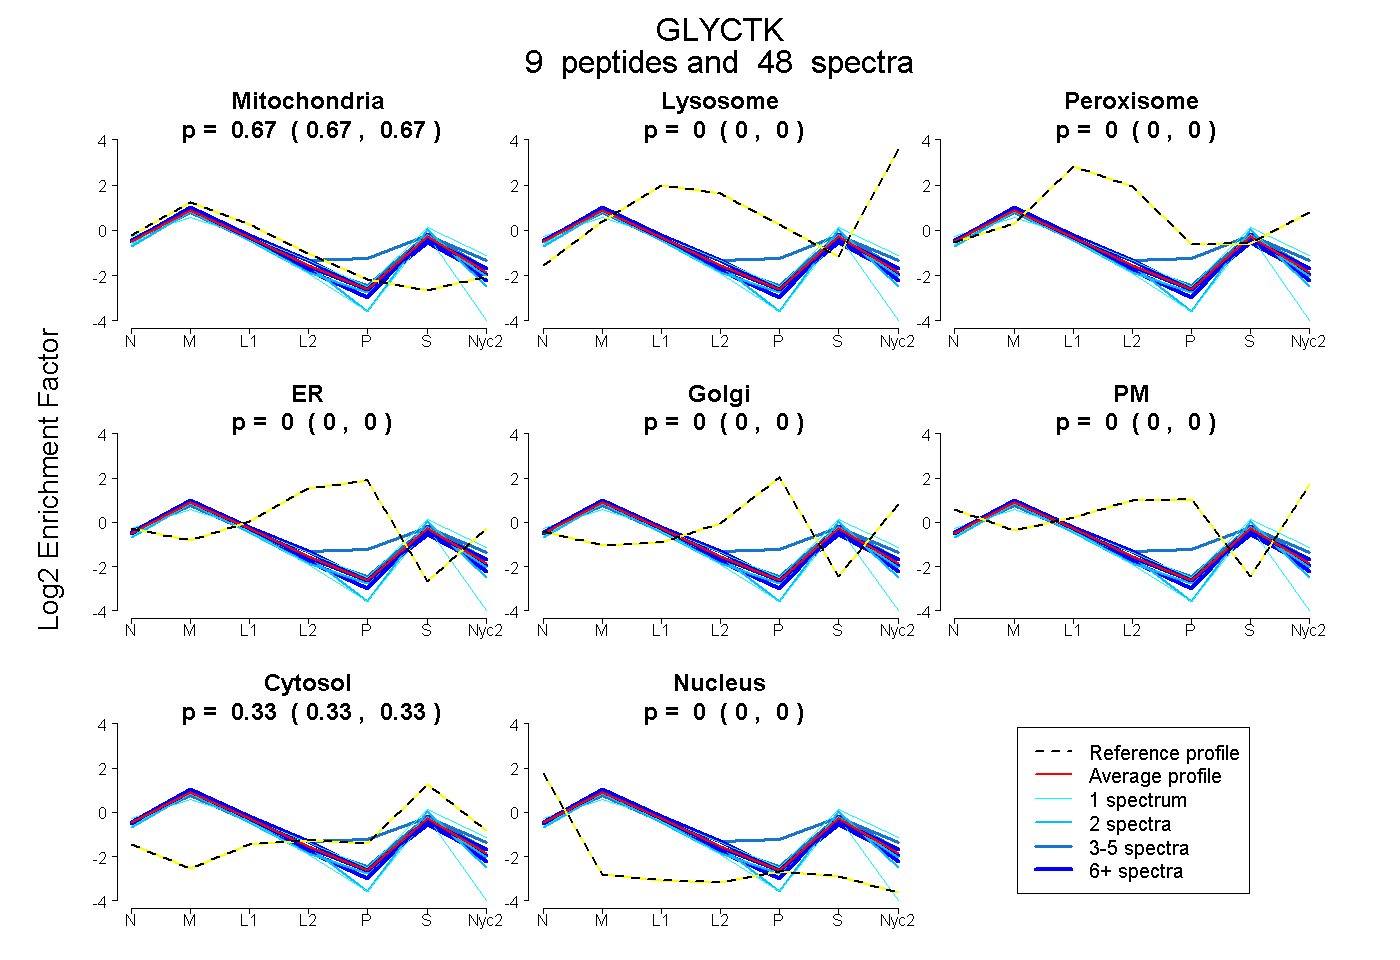
0.667 | 0.673
0.000 | 0.000
0.000 | 0.000
0.000 | 0.000
0.000 | 0.000
0.000 | 0.000
0.327 | 0.332
0.000 | 0.000
8peptides
spectra
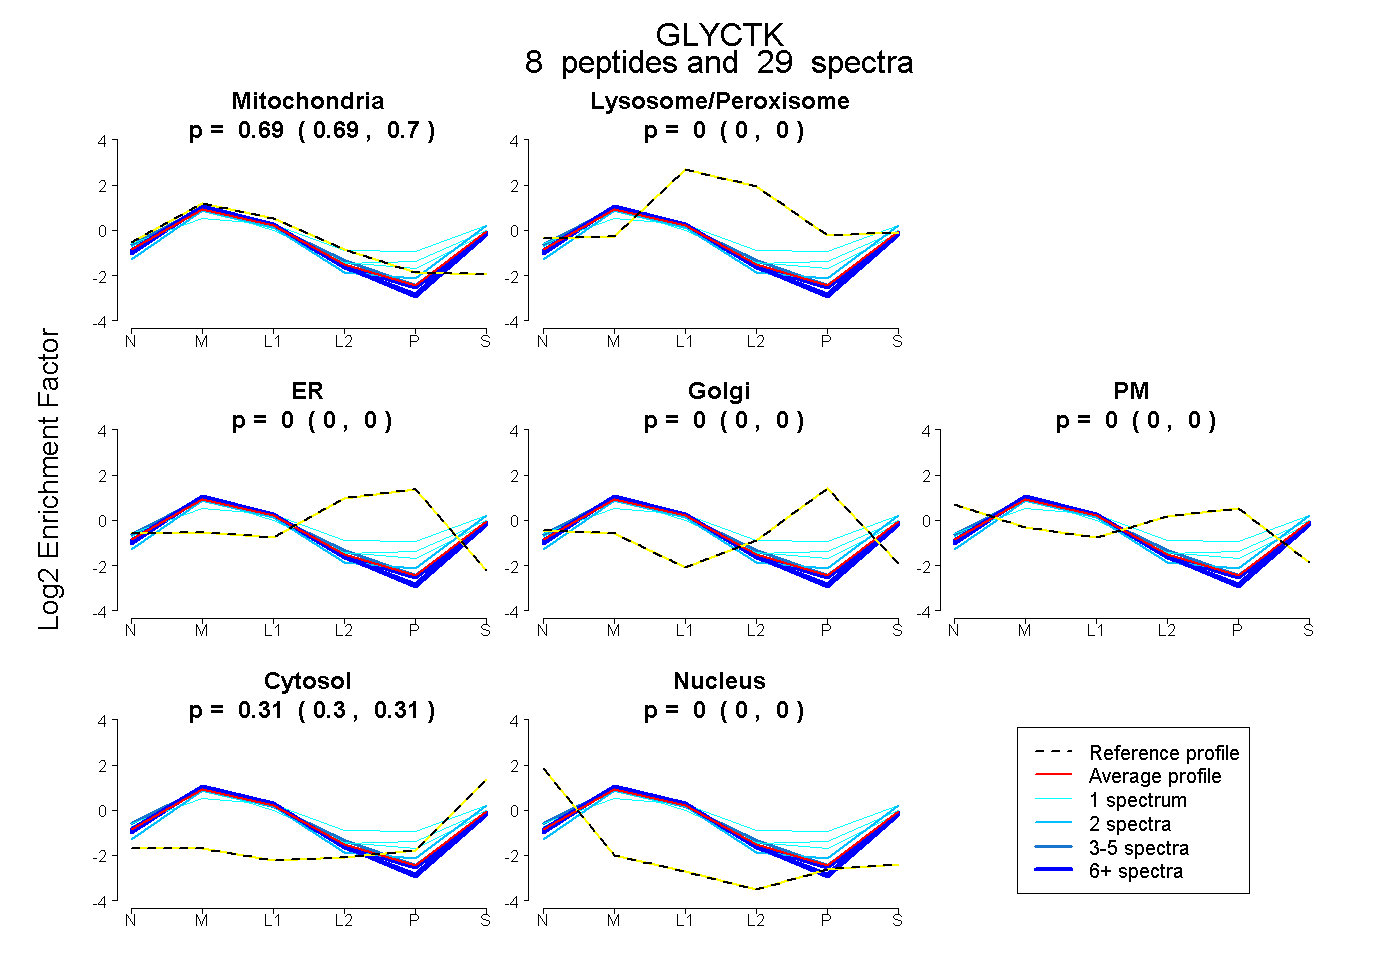
0.690 | 0.697
0.000 | 0.002
0.000 | 0.000
0.000 | 0.000
0.000 | 0.000
0.302 | 0.309
0.000 | 0.000