 9
9peptides
spectra
0.667 | 0.673
0.000 | 0.000
0.000 | 0.000
0.000 | 0.000
0.000 | 0.000
0.000 | 0.000
0.327 | 0.332
0.000 | 0.000
| Plot | Mito | Lyso | Perox | ER | Golgi | PM | Cytosol | Nucleus | |||||
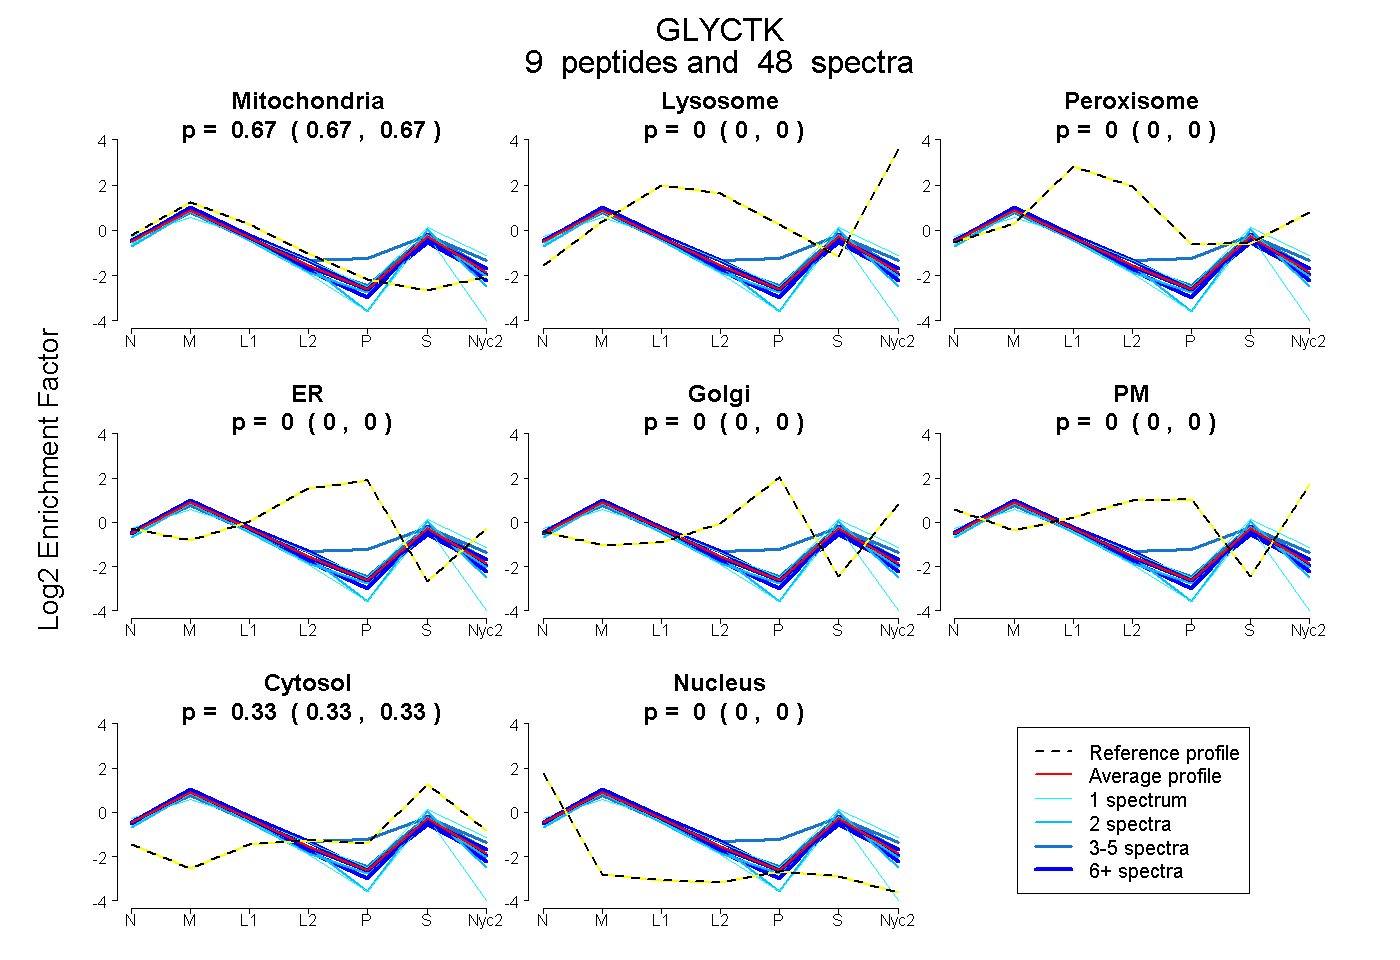
| Expt A |
9 peptides |
48 spectra |
|
0.670 0.667 | 0.673 |
0.000 0.000 | 0.000 |
0.000 0.000 | 0.000 |
0.000 0.000 | 0.000 |
0.000 0.000 | 0.000 |
0.000 0.000 | 0.000 |
0.330 0.327 | 0.332 |
0.000 0.000 | 0.000 |
| 5 spectra, NQELALR | 0.563 | 0.033 | 0.027 | 0.000 | 0.000 | 0.000 | 0.377 | 0.000 | ||
| 10 spectra, QAEVLGYHAMVLSTAMQGDVR | 0.723 | 0.000 | 0.000 | 0.000 | 0.000 | 0.000 | 0.277 | 0.000 | ||
| 1 spectrum, VAAACLTSSTAERPLEEEAK | 0.691 | 0.000 | 0.000 | 0.000 | 0.000 | 0.000 | 0.193 | 0.116 | ||
| 2 spectra, TFQLQENLYLVGFGK | 0.660 | 0.000 | 0.000 | 0.000 | 0.000 | 0.000 | 0.340 | 0.000 | ||
| 2 spectra, TLSLDPSGK | 0.668 | 0.000 | 0.000 | 0.000 | 0.000 | 0.000 | 0.332 | 0.000 | ||
| 8 spectra, GATIQELNTIR | 0.681 | 0.000 | 0.000 | 0.000 | 0.000 | 0.000 | 0.319 | 0.000 | ||
| 15 spectra, VAQFYGLLAR | 0.682 | 0.000 | 0.000 | 0.000 | 0.000 | 0.000 | 0.318 | 0.000 | ||
| 4 spectra, AAQAIQQLAER | 0.651 | 0.000 | 0.000 | 0.000 | 0.000 | 0.000 | 0.349 | 0.000 | ||
| 1 spectrum, QPLGPVDVLFLSGGTDGQDGPTK | 0.547 | 0.000 | 0.046 | 0.000 | 0.000 | 0.000 | 0.407 | 0.000 |
| Plot | Mito | Lyso or Perox | ER | Golgi | PM | Cytosol | Nucleus | ||||||
| Expt B |
8 peptides |
29 spectra |
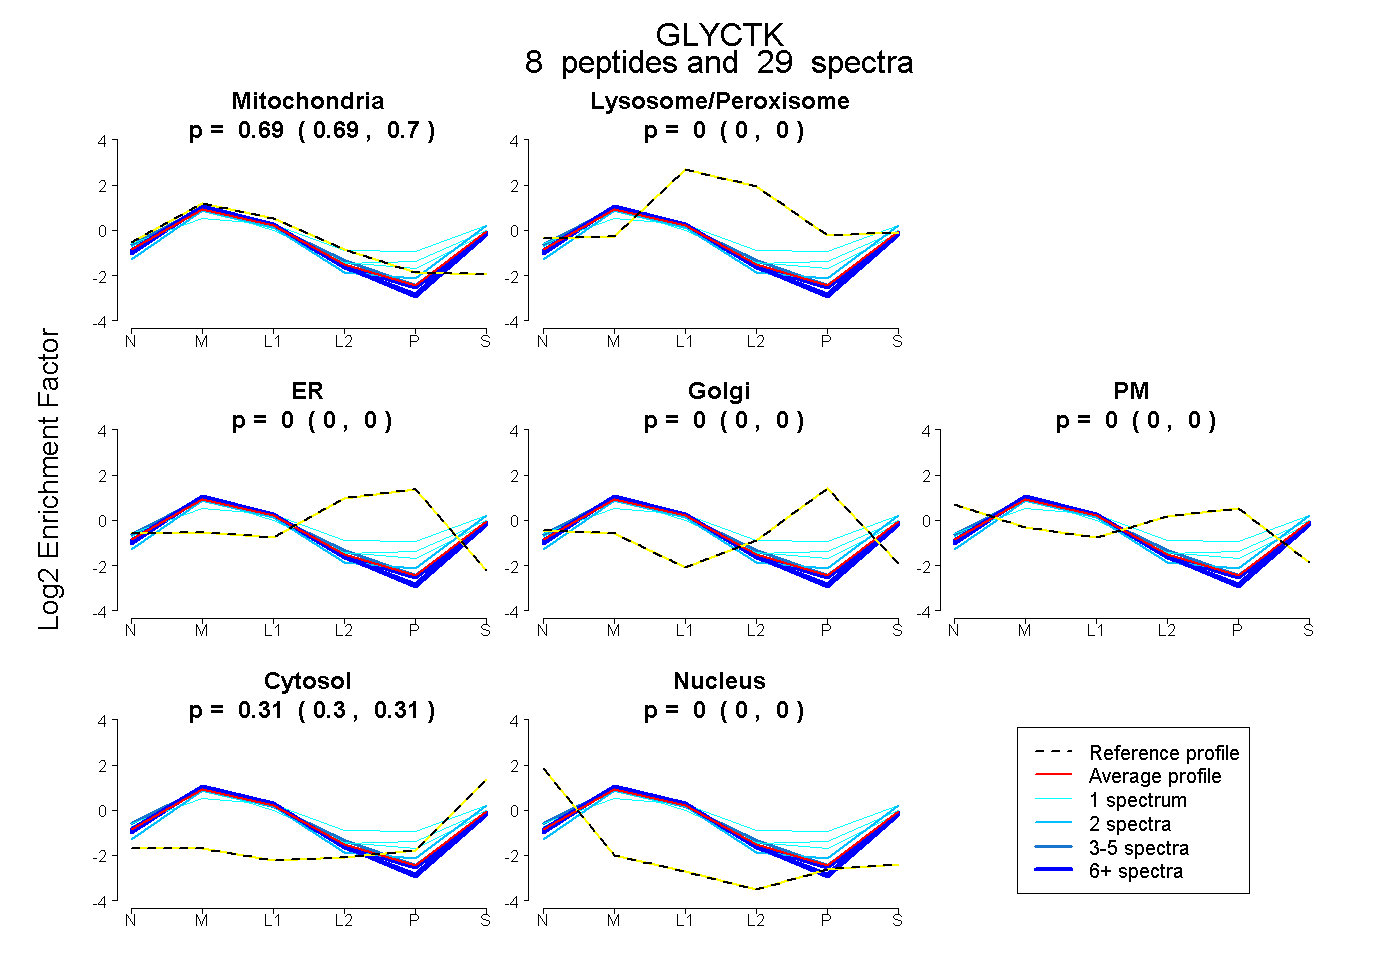 |
0.694 0.690 | 0.697 |
0.000 0.000 | 0.002 |
0.000 0.000 | 0.000 |
0.000 0.000 | 0.000 |
0.000 0.000 | 0.000 |
0.306 0.302 | 0.309 |
0.000 0.000 | 0.000 |
|||
| Plot | Lyso | Other | |||||||||||
| Expt C |
13 peptides |
144 spectra |
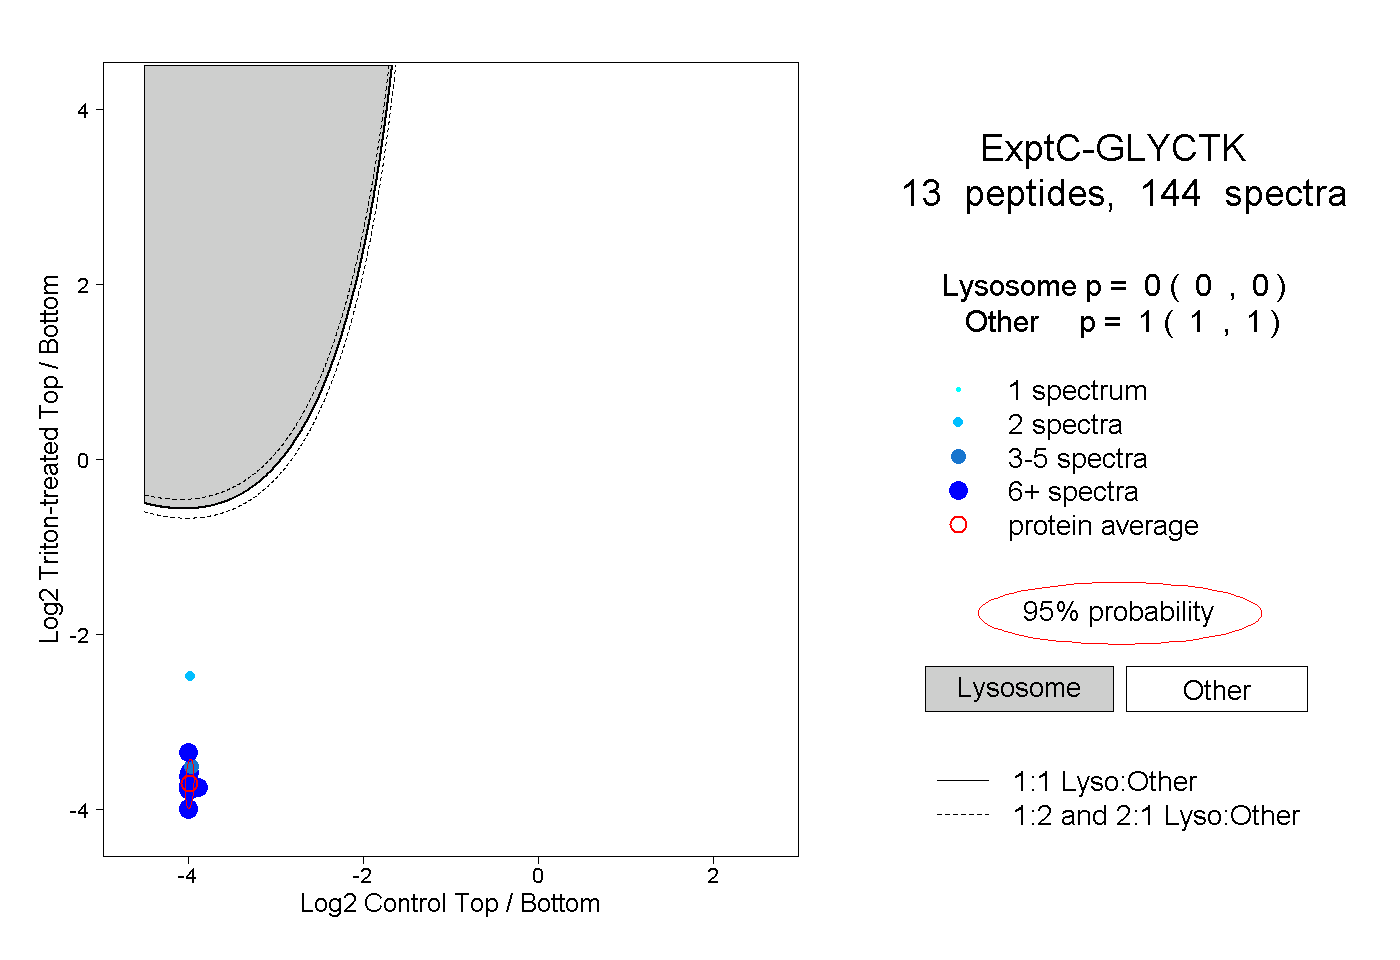 |
0.000 0.000 | 0.000 |
1.000 1.000 | 1.000 |
||||||||
| Plot | Lyso | Other | |||||||||||
| Expt D |
4 peptides |
9 spectra |
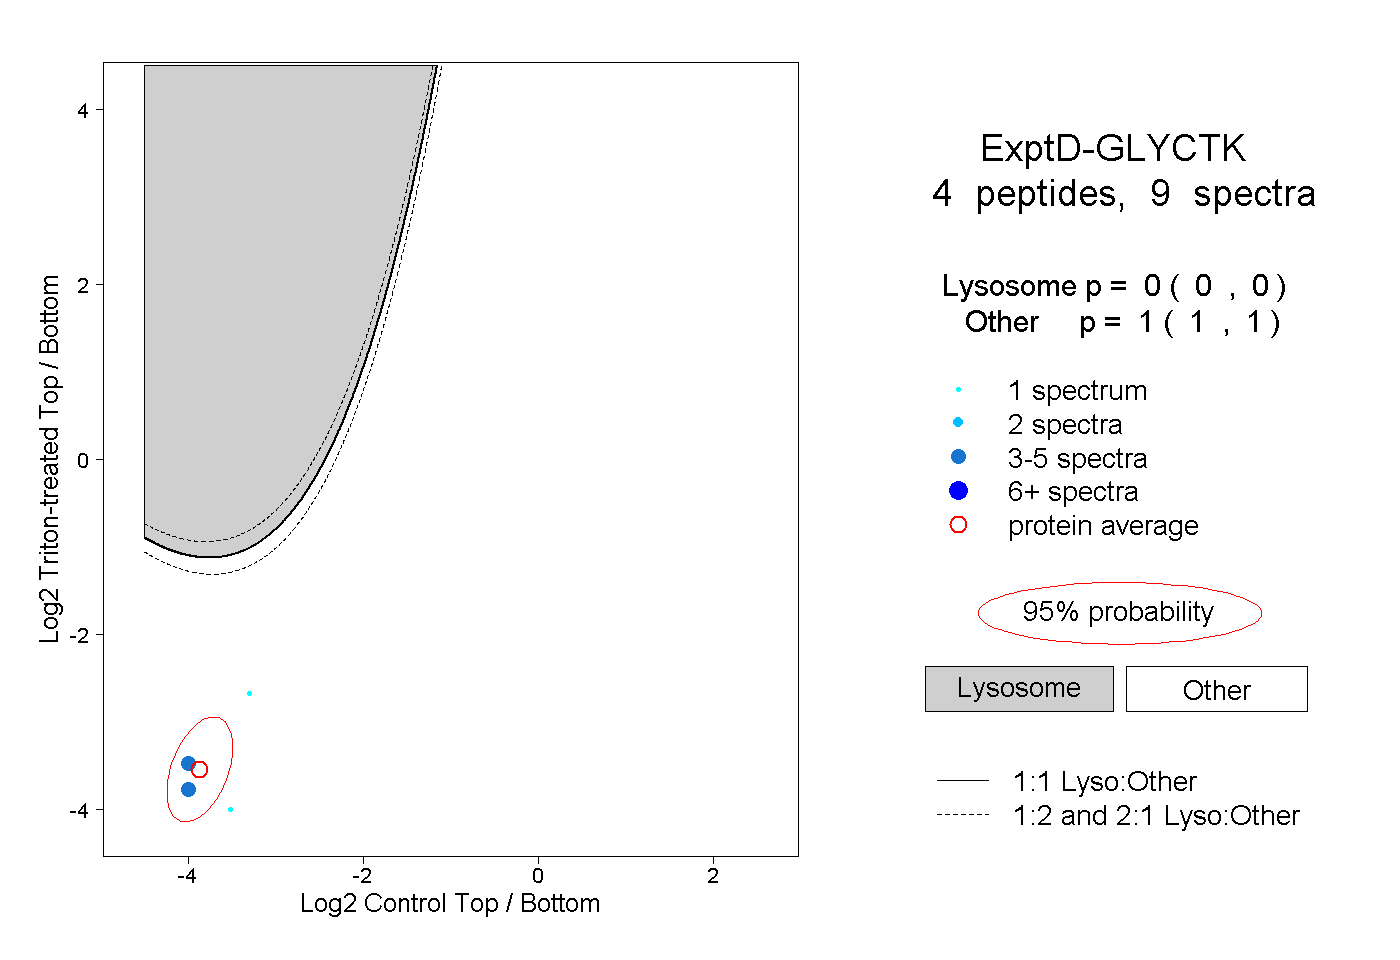 |
0.000 0.000 | 0.000 |
1.000 1.000 | 1.000 |