 3
3peptides
spectra
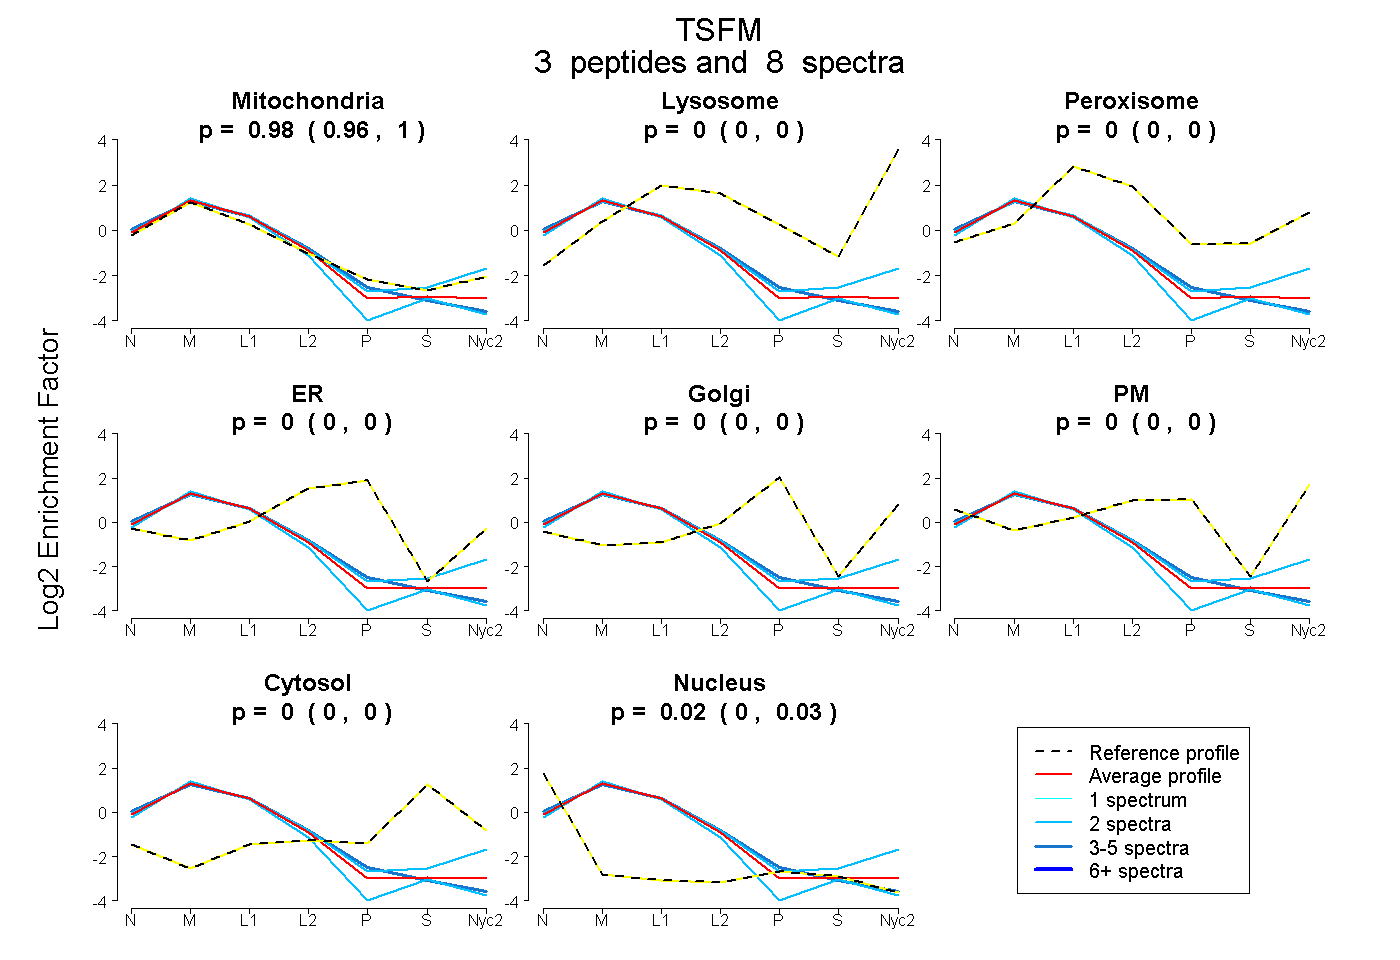
0.964 | 1.000
0.000 | 0.000
0.000 | 0.000
0.000 | 0.000
0.000 | 0.000
0.000 | 0.000
0.000 | 0.000
0.000 | 0.033
2peptides
spectra
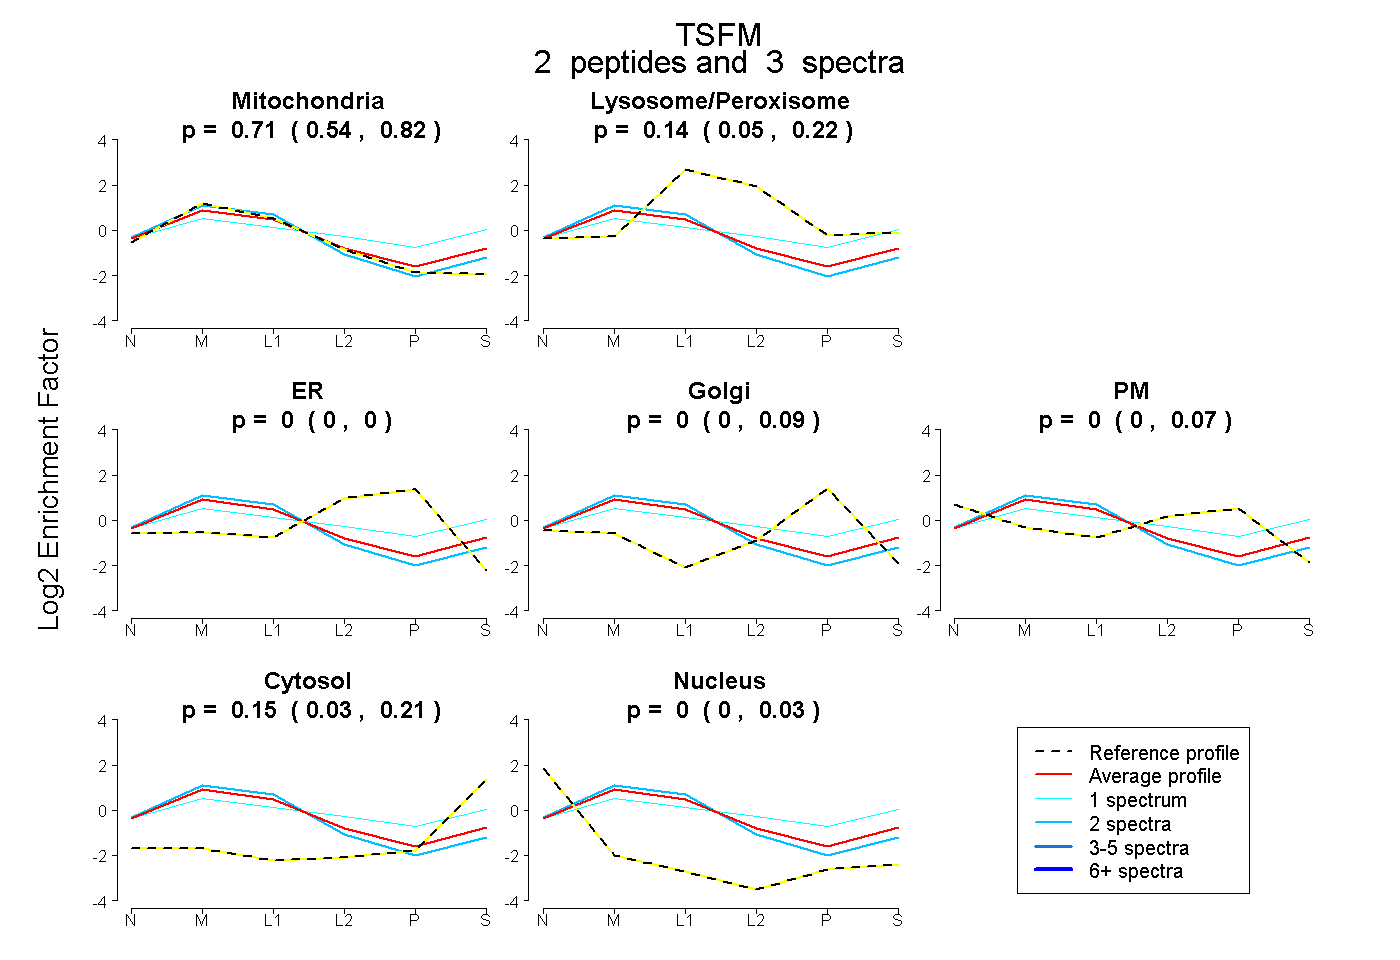
0.541 | 0.818
0.046 | 0.222
0.000 | 0.000
0.000 | 0.085
0.000 | 0.069
0.034 | 0.215
0.000 | 0.026
3peptides
spectra
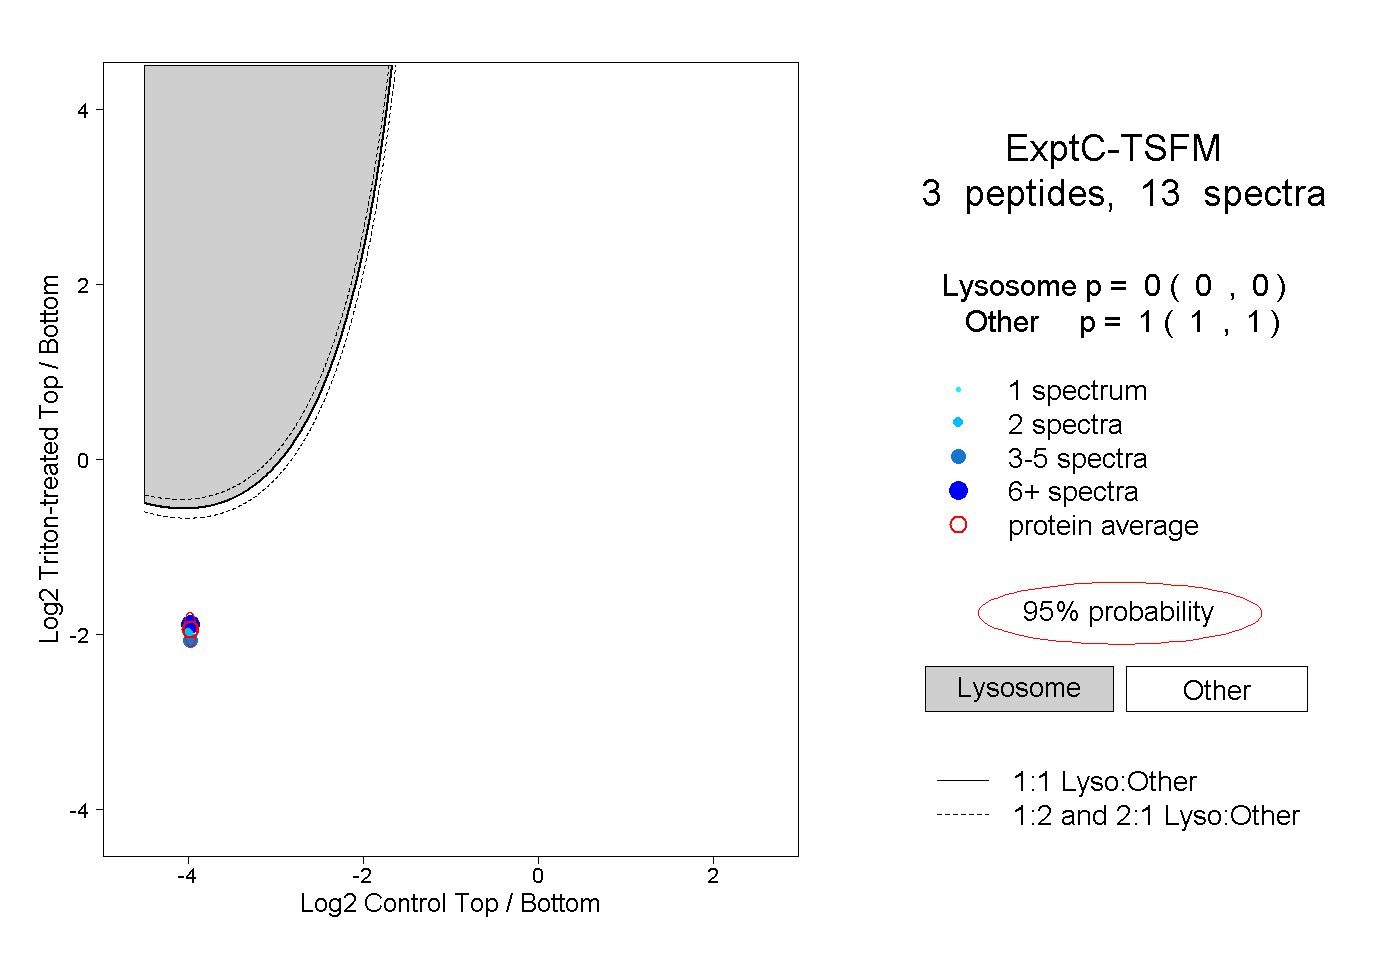
0.000 | 0.000
1.000 | 1.000
2peptides
spectra
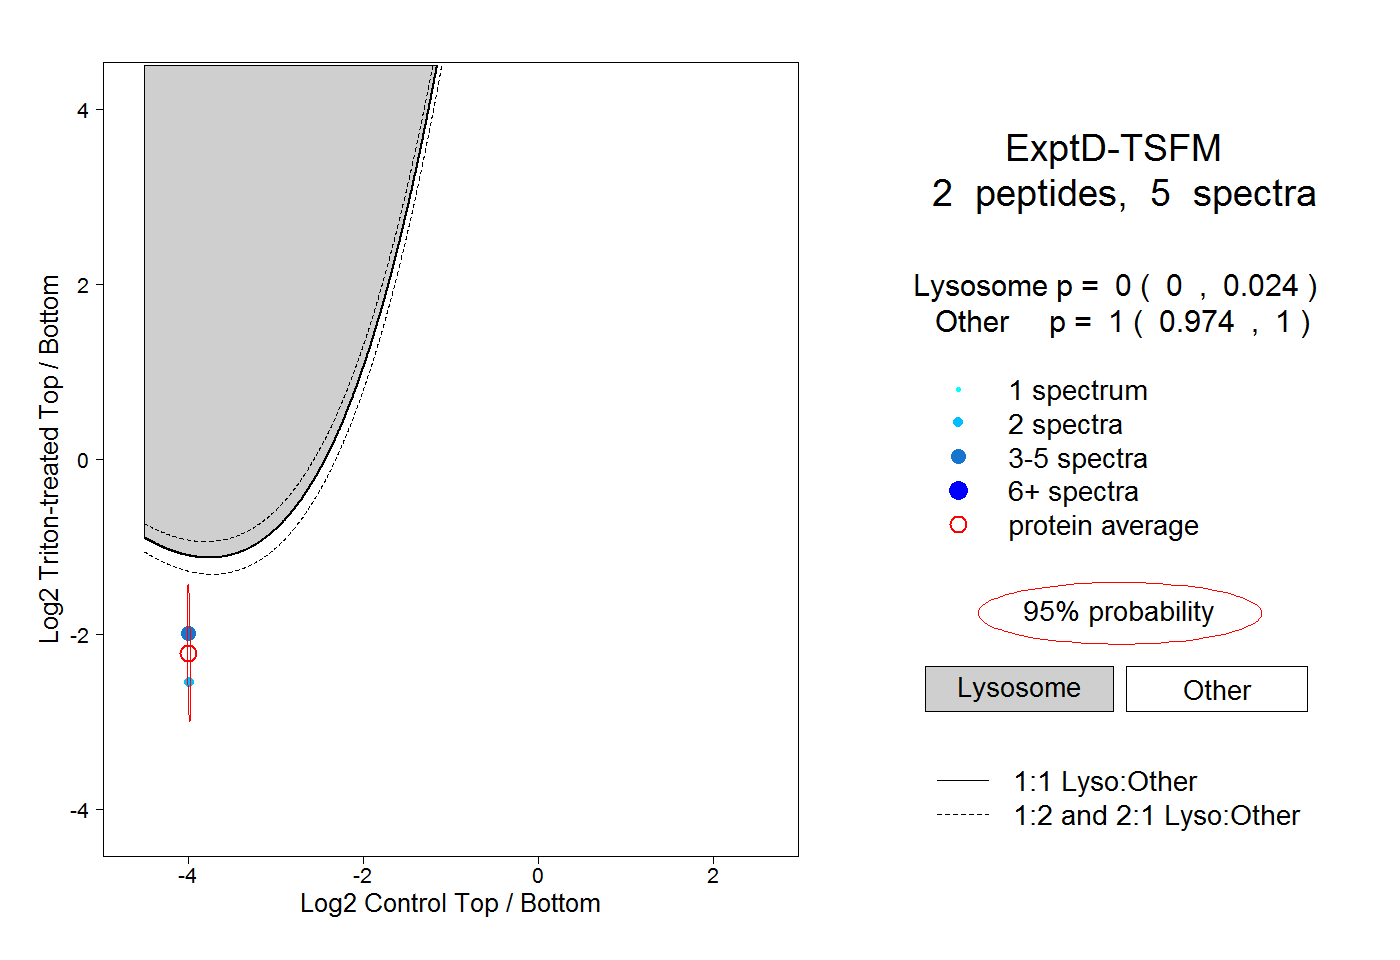
0.000 | 0.024
0.974 | 1.000