 3
3peptides
spectra
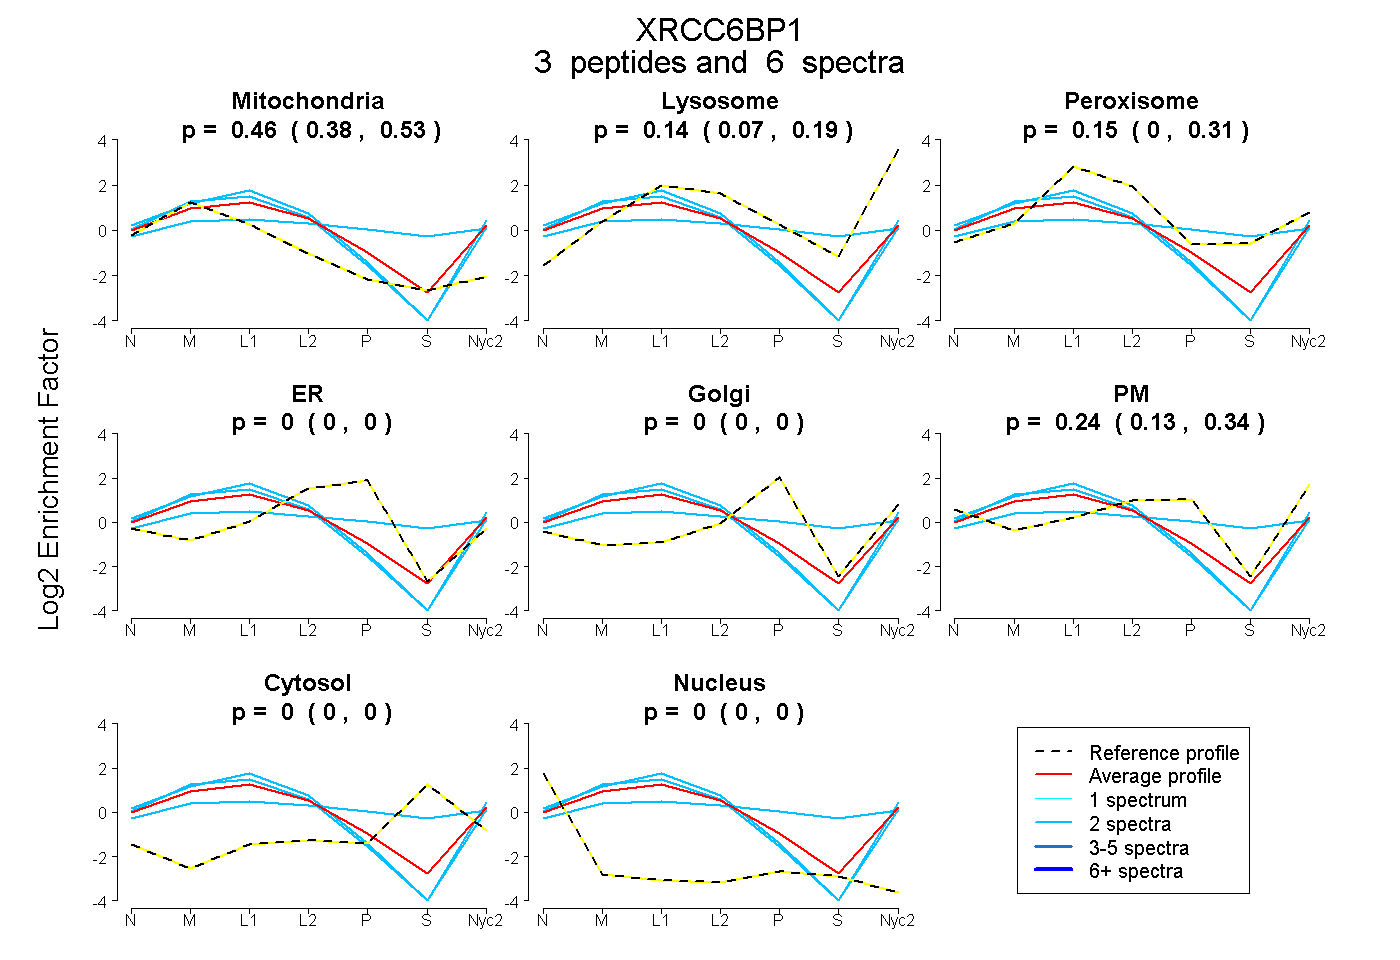
0.384 | 0.527
0.072 | 0.191
0.000 | 0.306
0.000 | 0.000
0.000 | 0.000
0.131 | 0.339
0.000 | 0.000
0.000 | 0.000
1peptide
spectra
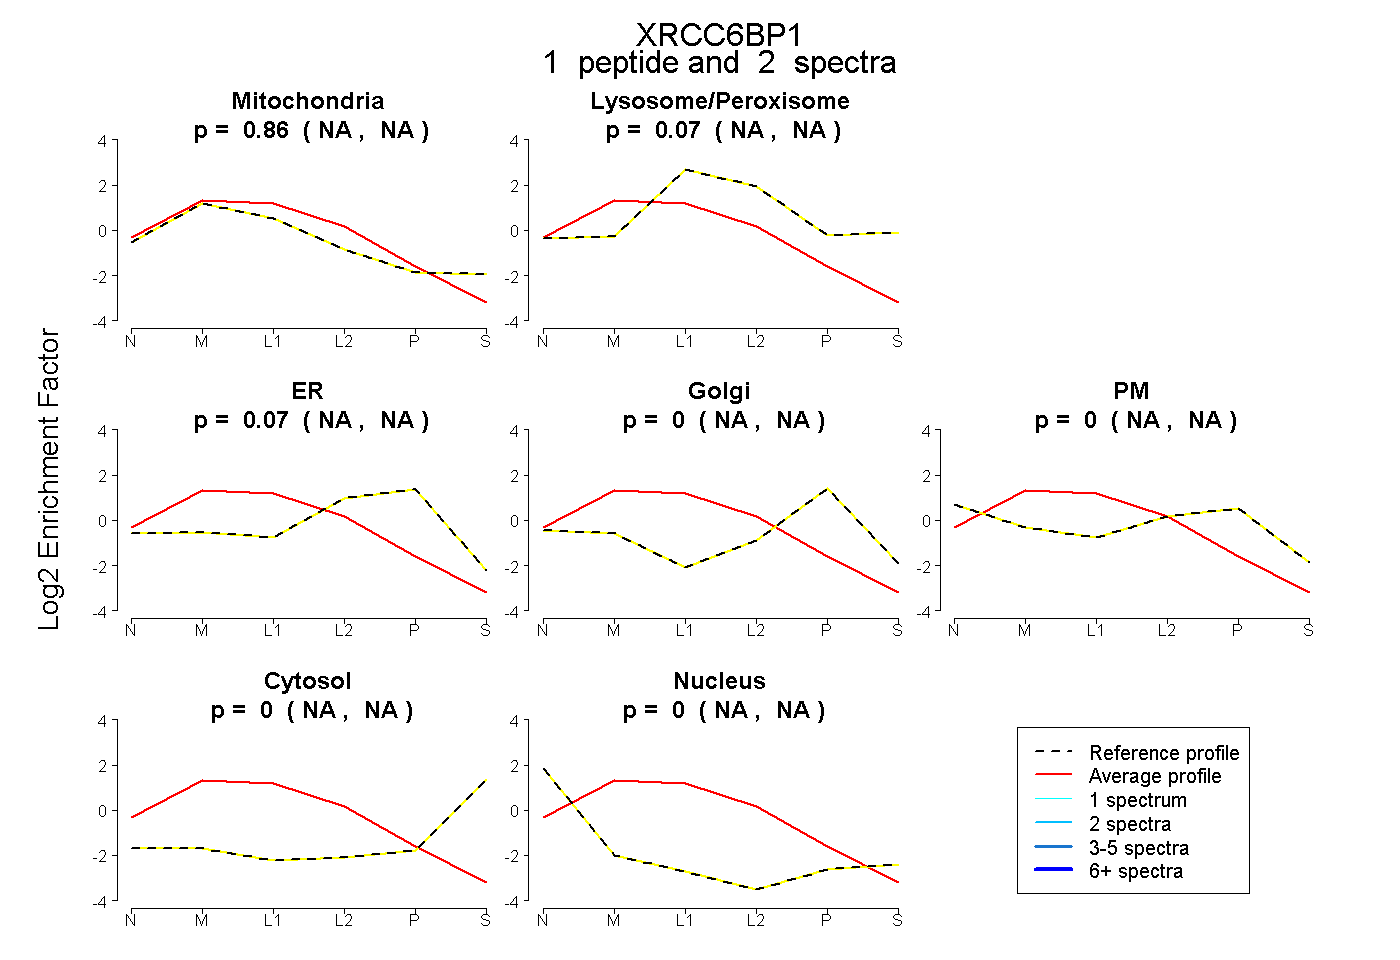
NA | NA
NA | NA
NA | NA
NA | NA
NA | NA
NA | NA
NA | NA
5peptides
spectra
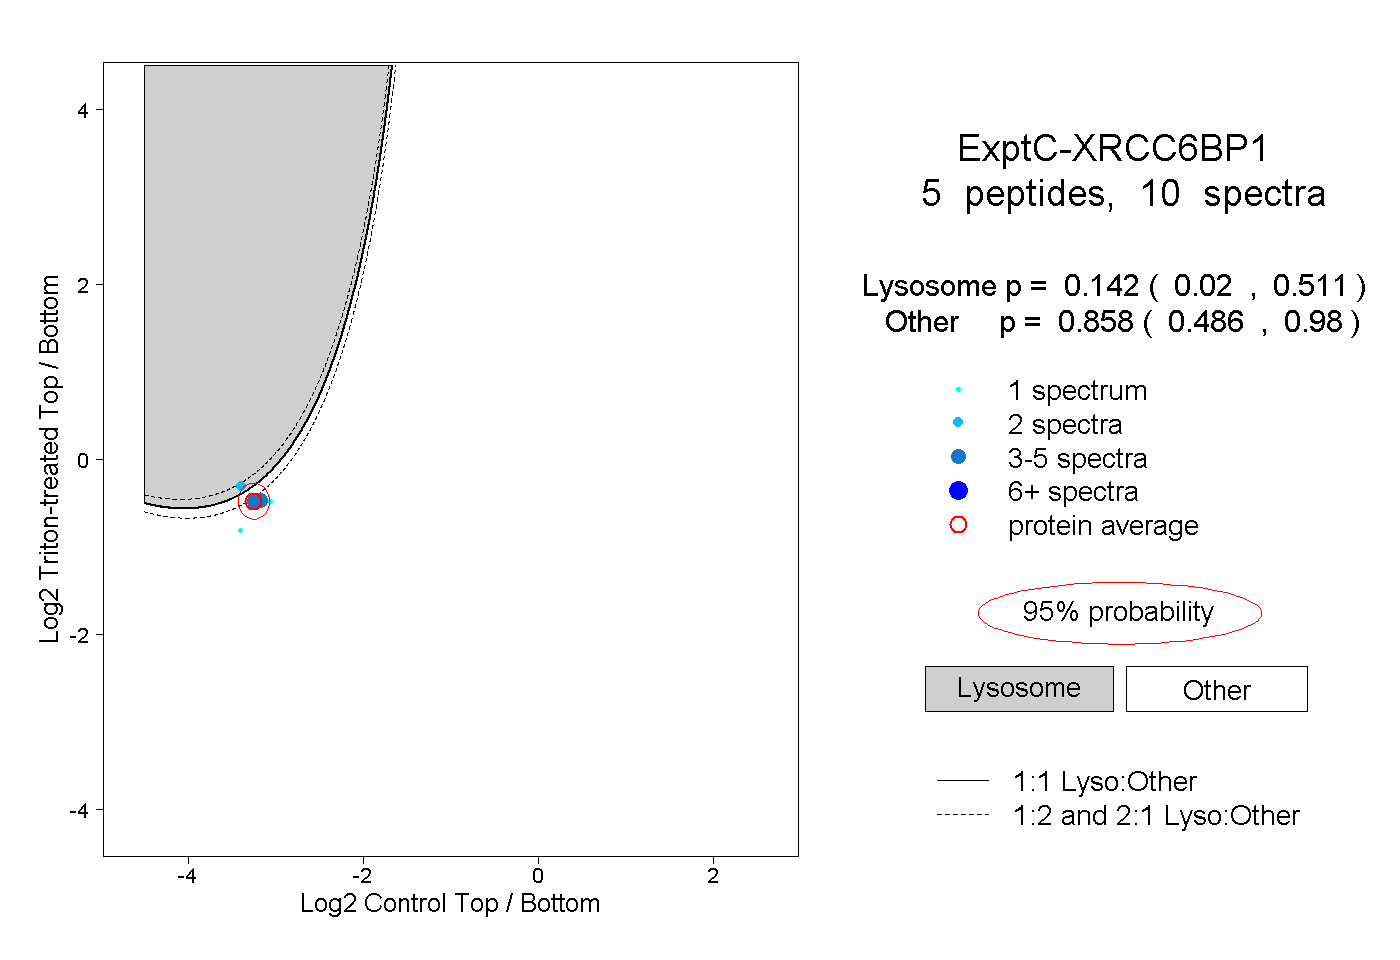
0.020 | 0.511
0.486 | 0.980
1peptide
spectrum
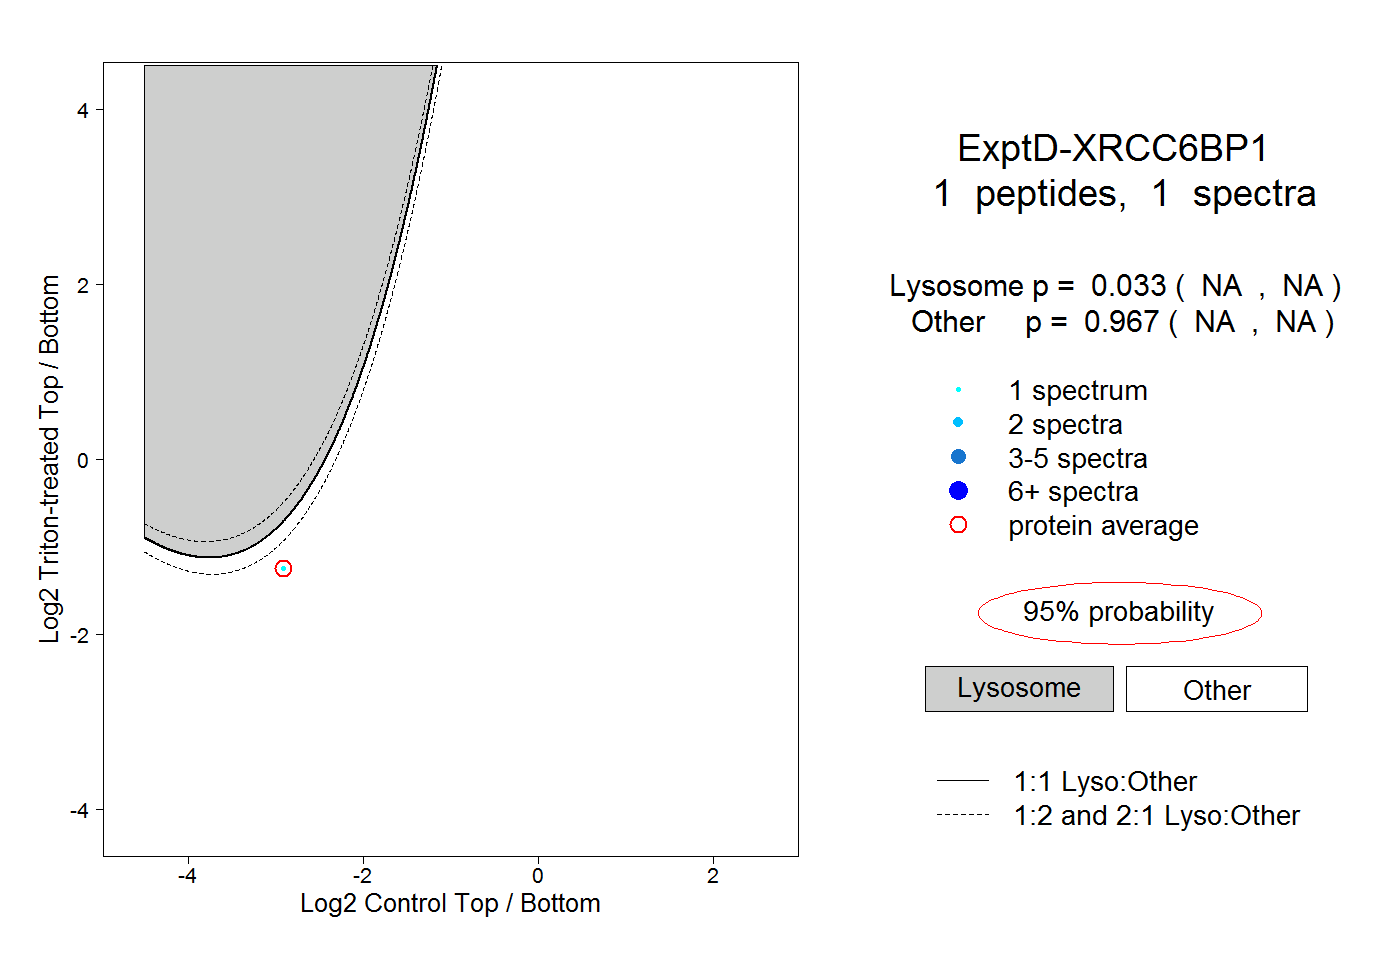
NA | NA
NA | NA