 3
3peptides
spectra
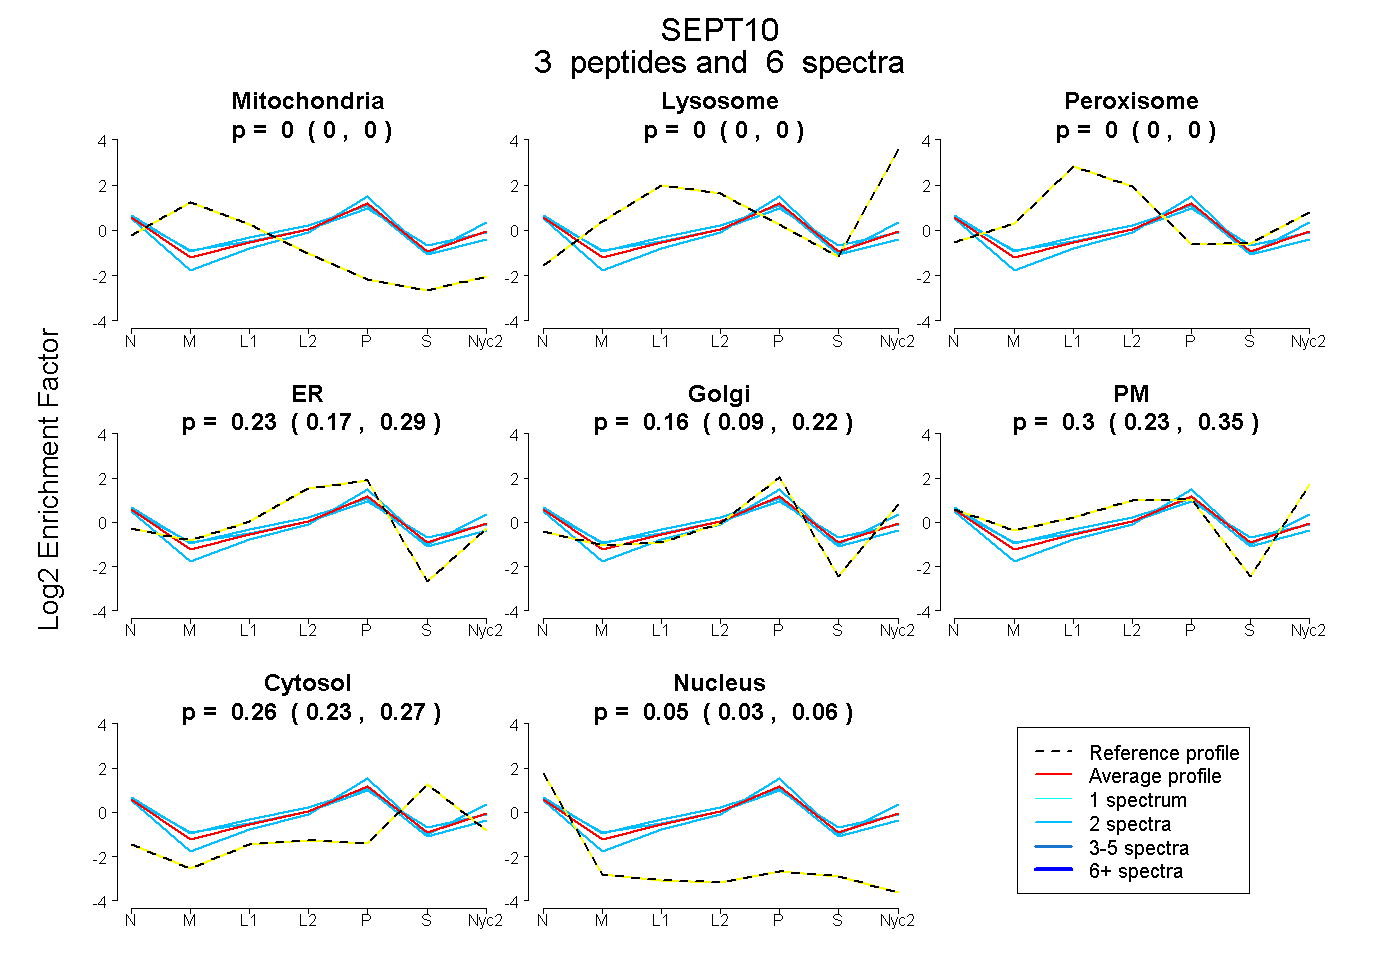
0.000 | 0.000
0.000 | 0.000
0.000 | 0.000
0.168 | 0.291
0.092 | 0.218
0.234 | 0.353
0.233 | 0.274
0.032 | 0.062
1peptide
spectrum
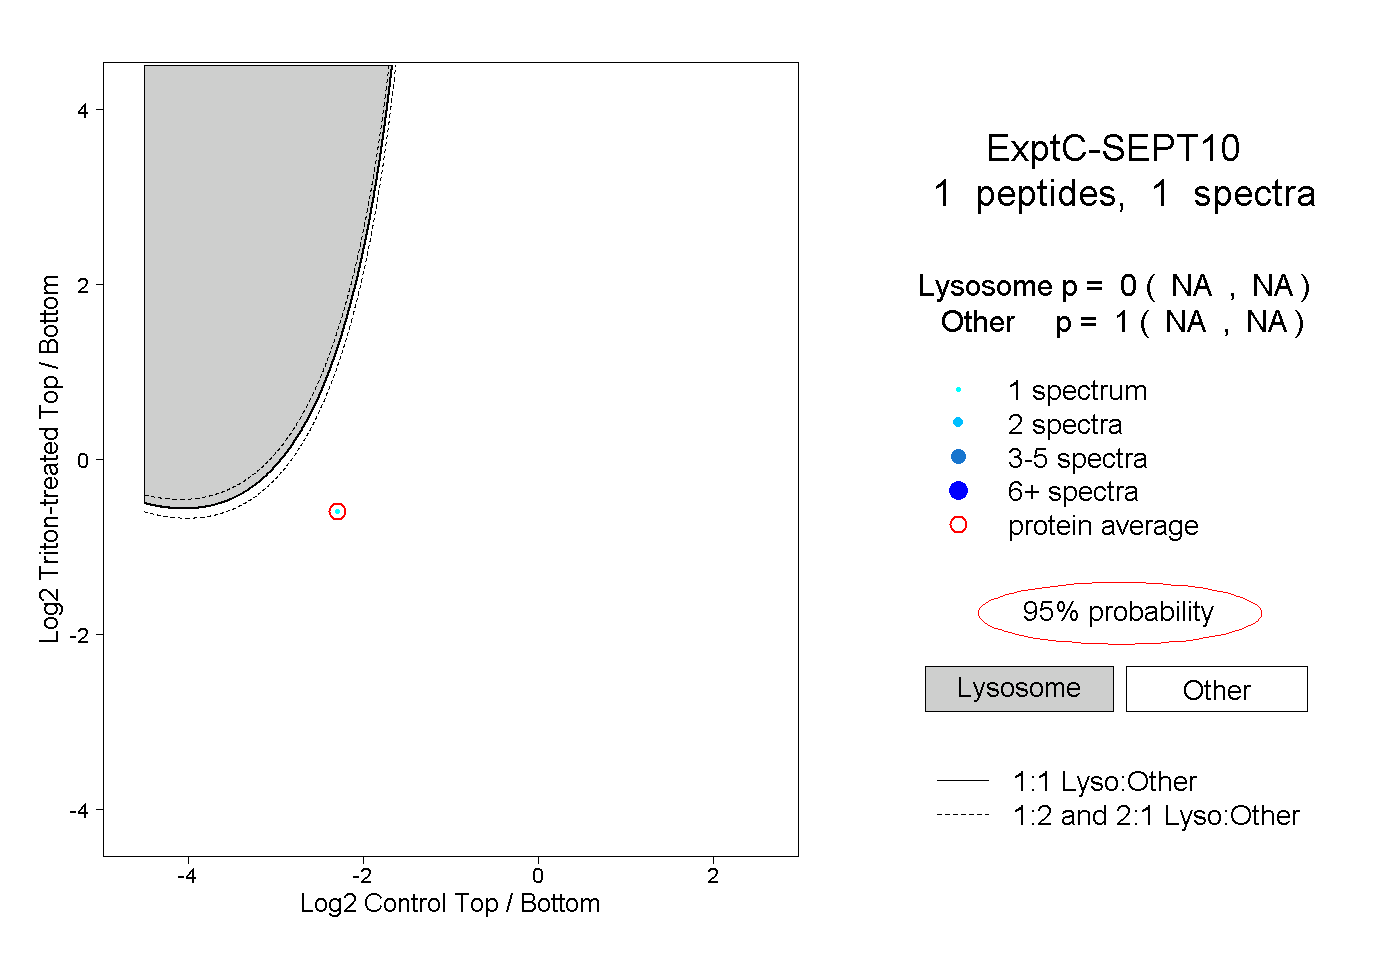
NA | NA
NA | NA
1peptide
spectra
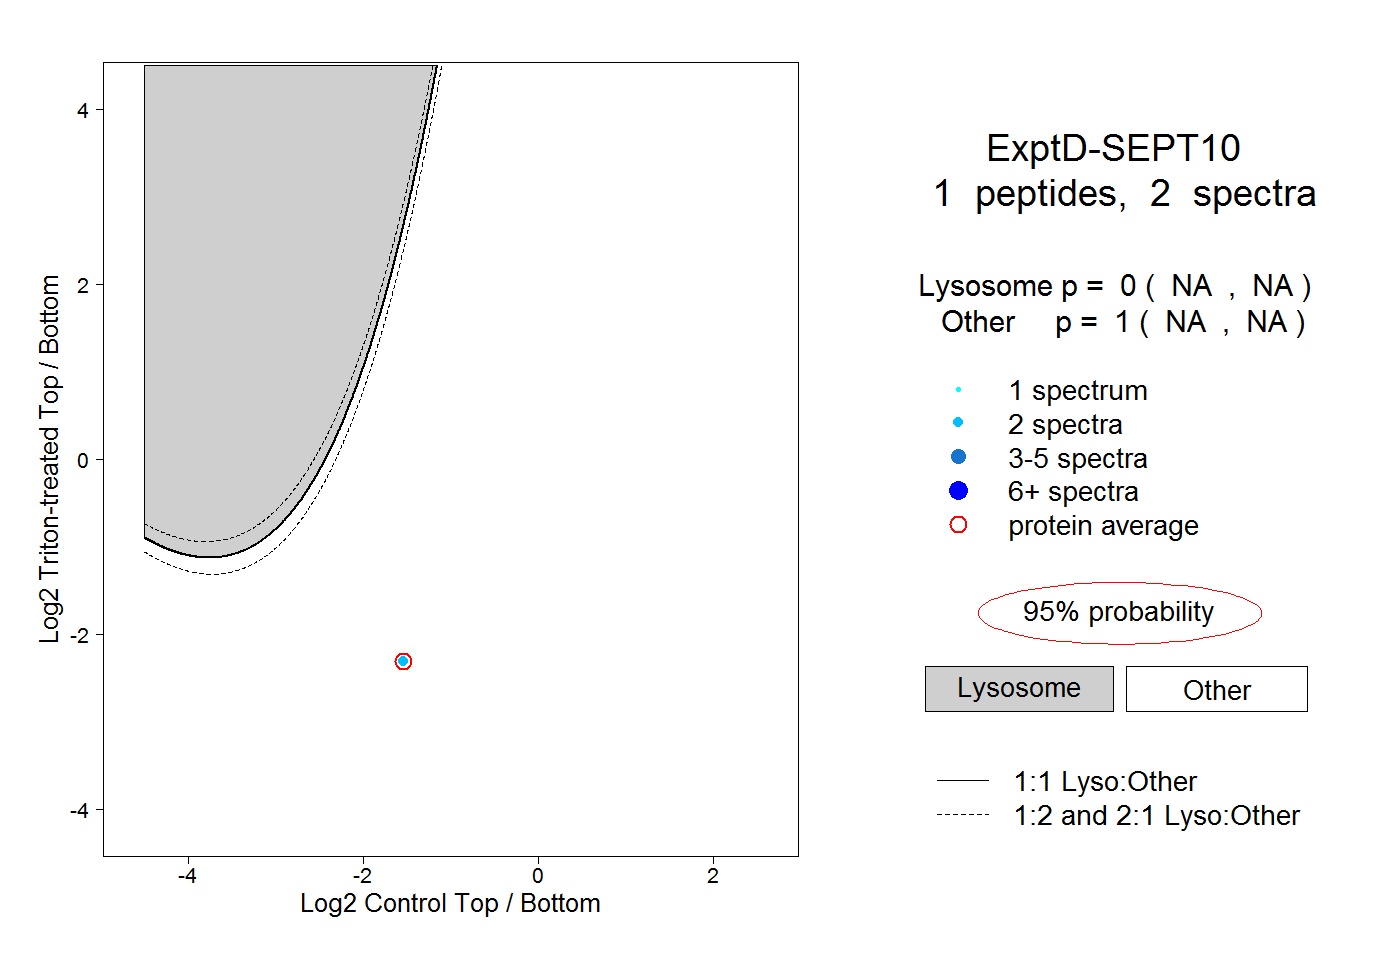
NA | NA
NA | NA