 21
21peptides
spectra
0.000 | 0.000
0.000 | 0.000
0.000 | 0.000
0.000 | 0.000
0.000 | 0.000
0.000 | 0.000
0.923 | 0.928
0.072 | 0.076
| Plot | Mito | Lyso | Perox | ER | Golgi | PM | Cytosol | Nucleus | |||||
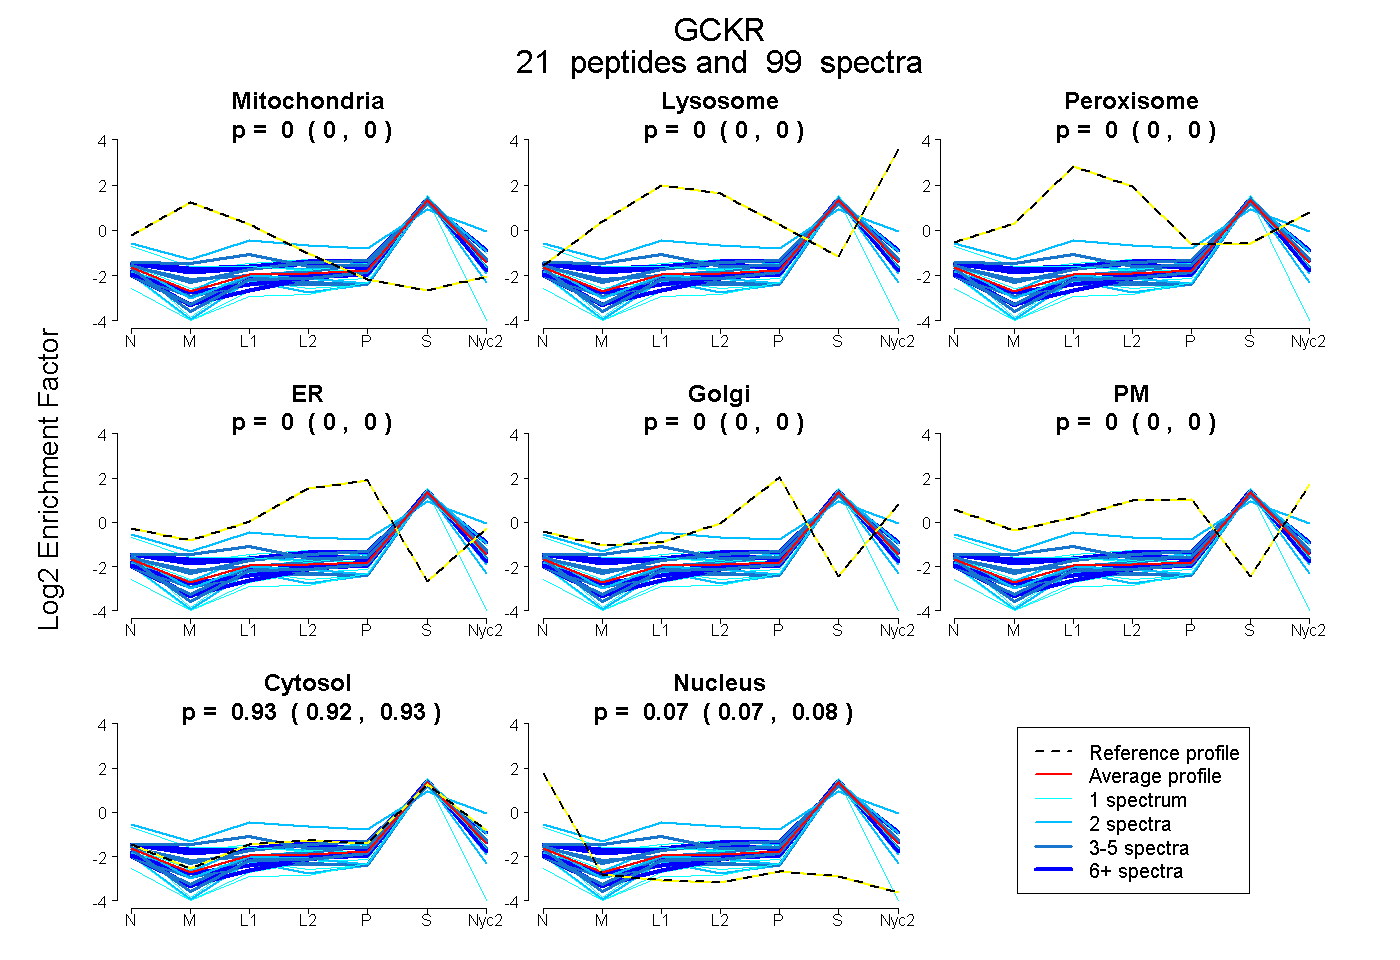
| Expt A |
21 peptides |
99 spectra |
|
0.000 0.000 | 0.000 |
0.000 0.000 | 0.000 |
0.000 0.000 | 0.000 |
0.000 0.000 | 0.000 |
0.000 0.000 | 0.000 |
0.000 0.000 | 0.000 |
0.926 0.923 | 0.928 |
0.074 0.072 | 0.076 |
| 1 spectrum, EPDGGLVVLSGGGTSGR | 0.000 | 0.000 | 0.000 | 0.000 | 0.000 | 0.000 | 0.892 | 0.108 | ||
| 1 spectrum, QVGISLEK | 0.000 | 0.000 | 0.000 | 0.000 | 0.000 | 0.000 | 0.897 | 0.103 | ||
| 16 spectra, NDPIEDWR | 0.000 | 0.000 | 0.000 | 0.000 | 0.000 | 0.000 | 0.901 | 0.099 | ||
| 7 spectra, IATLMK | 0.087 | 0.000 | 0.000 | 0.000 | 0.000 | 0.000 | 0.913 | 0.000 | ||
| 4 spectra, GLGQKPLYTYLIAGGDR | 0.000 | 0.000 | 0.000 | 0.000 | 0.000 | 0.000 | 0.941 | 0.059 | ||
| 5 spectra, TVDQGVVSSQR | 0.000 | 0.000 | 0.000 | 0.000 | 0.000 | 0.000 | 0.913 | 0.087 | ||
| 4 spectra, SALSGPGQK | 0.000 | 0.000 | 0.000 | 0.000 | 0.000 | 0.000 | 0.968 | 0.032 | ||
| 1 spectrum, FSGQSK | 0.000 | 0.000 | 0.000 | 0.000 | 0.000 | 0.000 | 0.941 | 0.059 | ||
| 11 spectra, ILQNHMLDLR | 0.070 | 0.000 | 0.000 | 0.000 | 0.000 | 0.000 | 0.911 | 0.018 | ||
| 2 spectra, CSISEAK | 0.000 | 0.000 | 0.000 | 0.000 | 0.000 | 0.000 | 0.918 | 0.082 | ||
| 2 spectra, STQALEDPPACGTLN | 0.000 | 0.000 | 0.190 | 0.000 | 0.000 | 0.126 | 0.684 | 0.000 | ||
| 2 spectra, AHQVTYSQSSK | 0.000 | 0.000 | 0.000 | 0.000 | 0.000 | 0.000 | 0.856 | 0.144 | ||
| 4 spectra, VQEVLK | 0.151 | 0.000 | 0.000 | 0.000 | 0.000 | 0.000 | 0.849 | 0.000 | ||
| 1 spectrum, CLLEILR | 0.086 | 0.000 | 0.000 | 0.000 | 0.000 | 0.000 | 0.914 | 0.000 | ||
| 4 spectra, LSAASSVCEVVR | 0.000 | 0.000 | 0.000 | 0.000 | 0.000 | 0.000 | 0.932 | 0.068 | ||
| 4 spectra, GFLIGDHSDMFNQK | 0.000 | 0.000 | 0.000 | 0.000 | 0.000 | 0.000 | 0.891 | 0.109 | ||
| 10 spectra, ILLETLLLAAHK | 0.000 | 0.000 | 0.000 | 0.000 | 0.000 | 0.000 | 0.895 | 0.105 | ||
| 2 spectra, QEAFVLNPAIGPEGLSGSSR | 0.000 | 0.000 | 0.000 | 0.000 | 0.000 | 0.000 | 0.922 | 0.078 | ||
| 16 spectra, ALAMLQR | 0.000 | 0.000 | 0.000 | 0.000 | 0.000 | 0.000 | 0.933 | 0.067 | ||
| 1 spectrum, AAPISCHVQVAHEK | 0.000 | 0.000 | 0.000 | 0.000 | 0.000 | 0.000 | 0.700 | 0.300 | ||
| 1 spectrum, SNPLTR | 0.107 | 0.000 | 0.000 | 0.000 | 0.000 | 0.000 | 0.815 | 0.077 |
| Plot | Mito | Lyso or Perox | ER | Golgi | PM | Cytosol | Nucleus | ||||||
| Expt B |
9 peptides |
23 spectra |
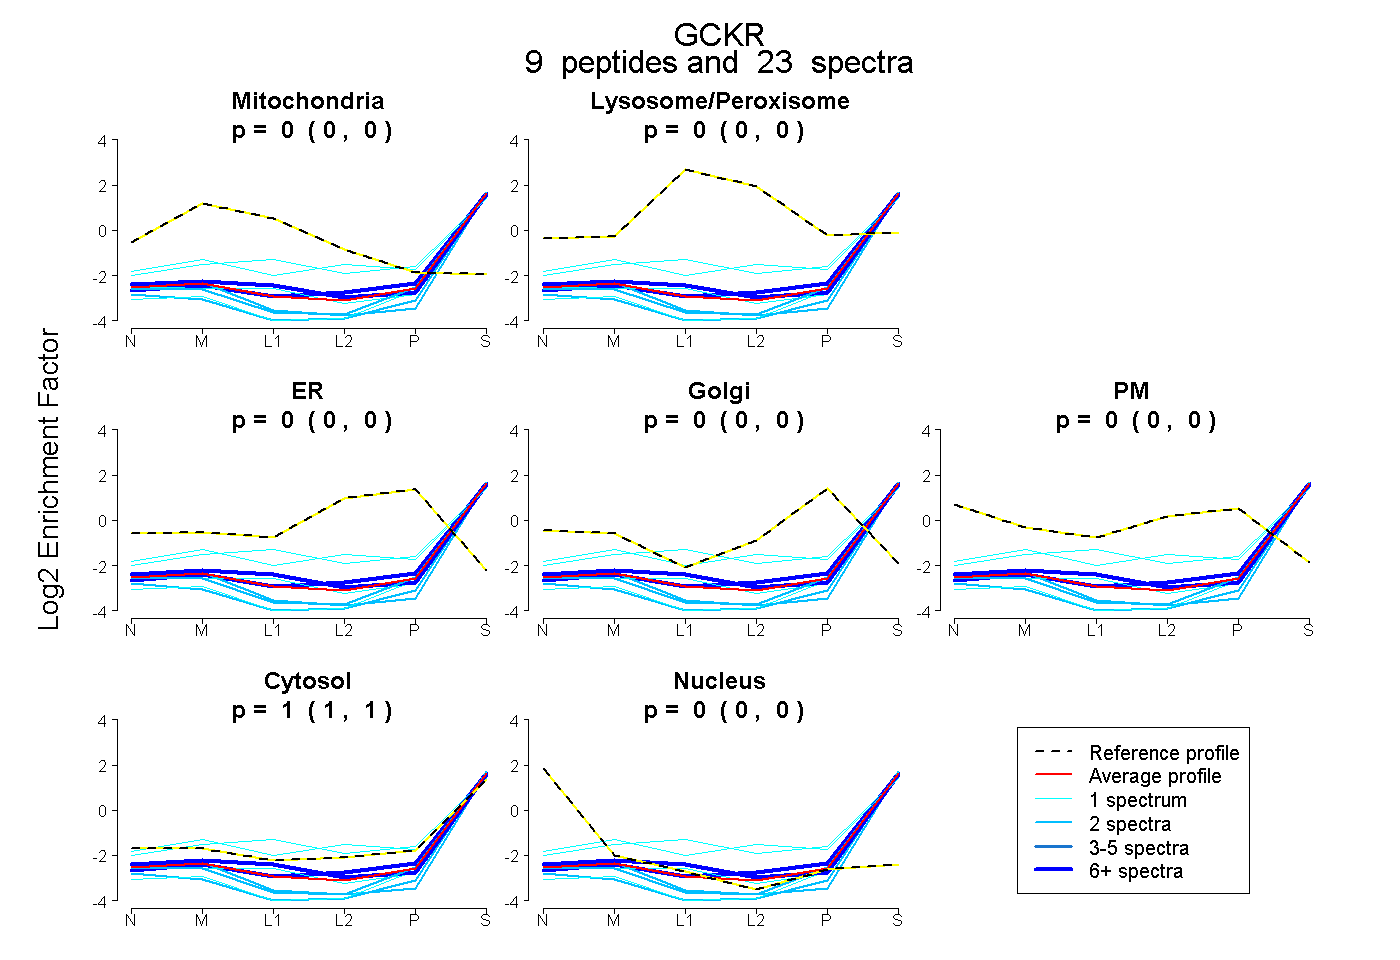 |
0.000 0.000 | 0.000 |
0.000 0.000 | 0.000 |
0.000 0.000 | 0.000 |
0.000 0.000 | 0.000 |
0.000 0.000 | 0.000 |
1.000 1.000 | 1.000 |
0.000 0.000 | 0.000 |
|||
| Plot | Lyso | Other | |||||||||||
| Expt C |
22 peptides |
84 spectra |
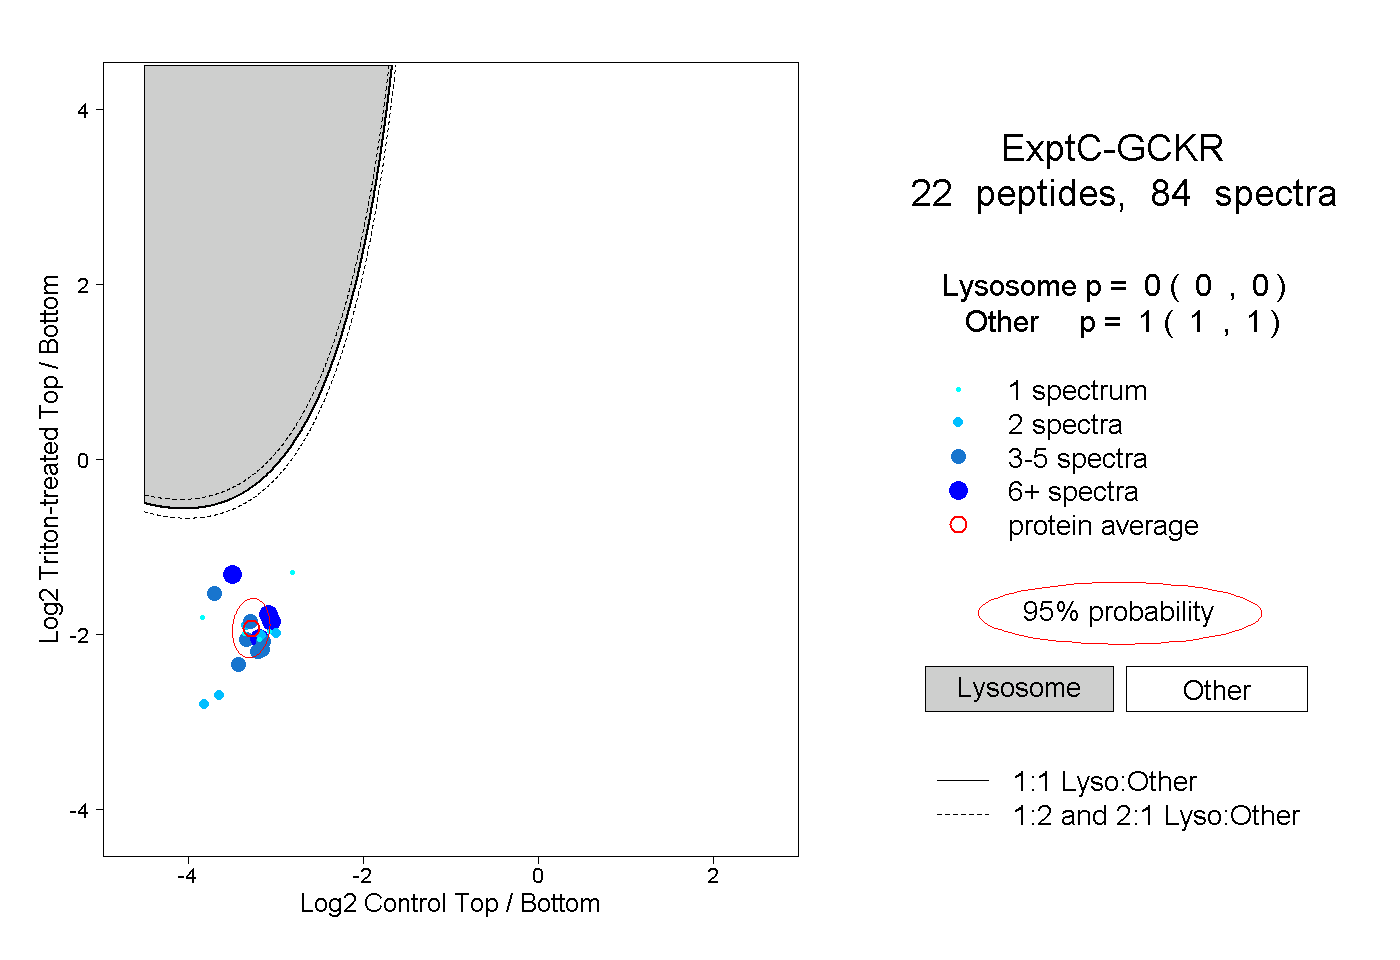 |
0.000 0.000 | 0.000 |
1.000 1.000 | 1.000 |
||||||||
| Plot | Lyso | Other | |||||||||||
| Expt D |
2 peptides |
2 spectra |
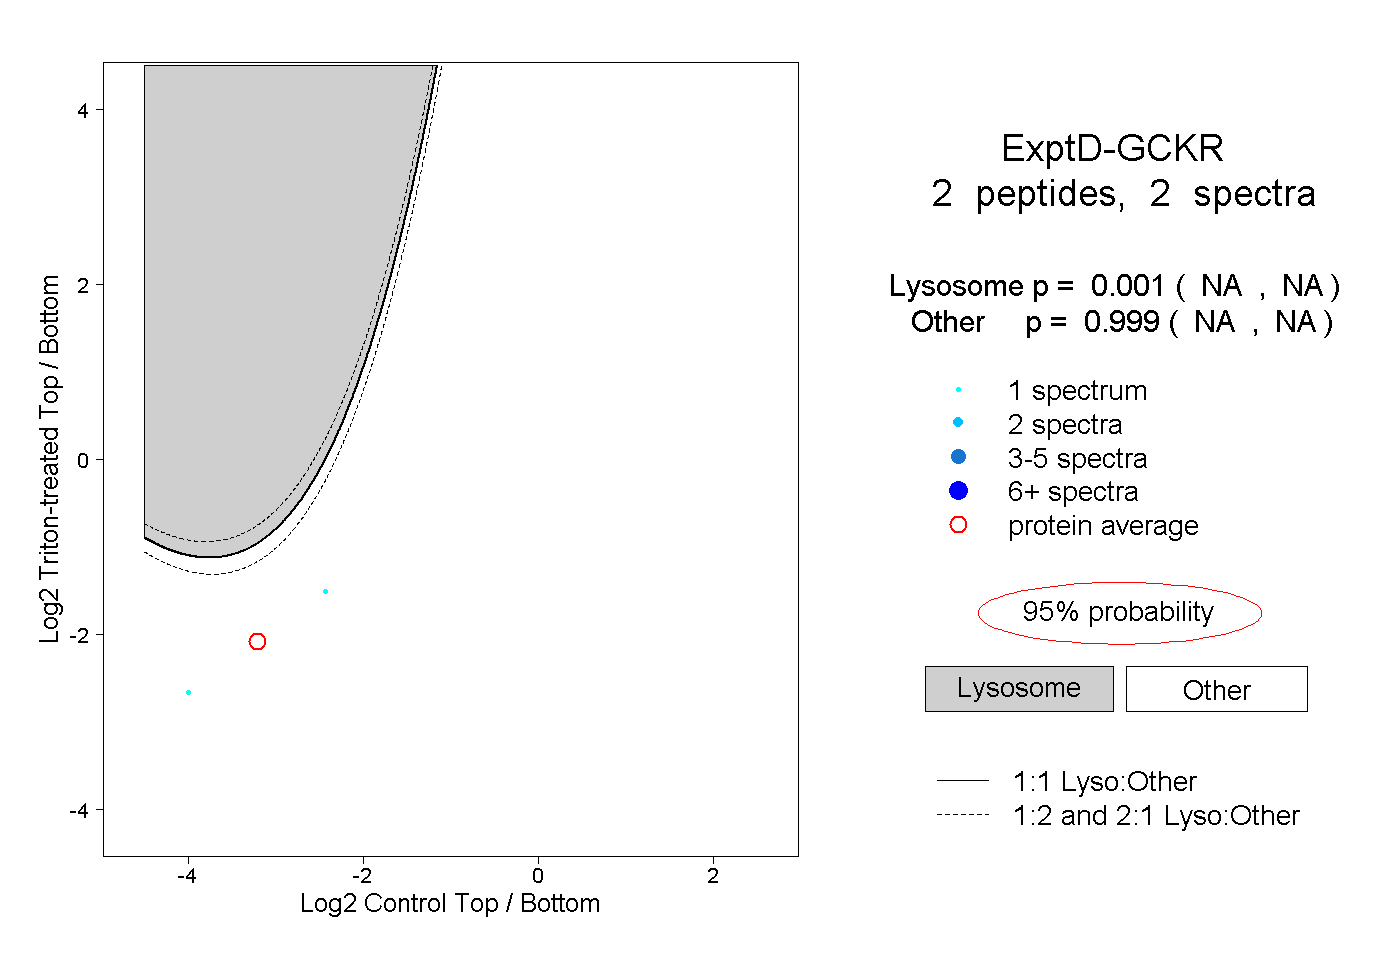 |
0.001 NA | NA |
0.999 NA | NA |