 1
1peptide
spectra
0.000 | 0.000
0.345 | 0.366
0.000 | 0.000
0.000 | 0.000
0.066 | 0.103
0.366 | 0.411
0.160 | 0.172
0.000 | 0.000
2peptides
spectra
0.273 | 0.986
0.014 | 0.724
| Plot | Mito | Lyso | Perox | ER | Golgi | PM | Cytosol | Nucleus | |||||
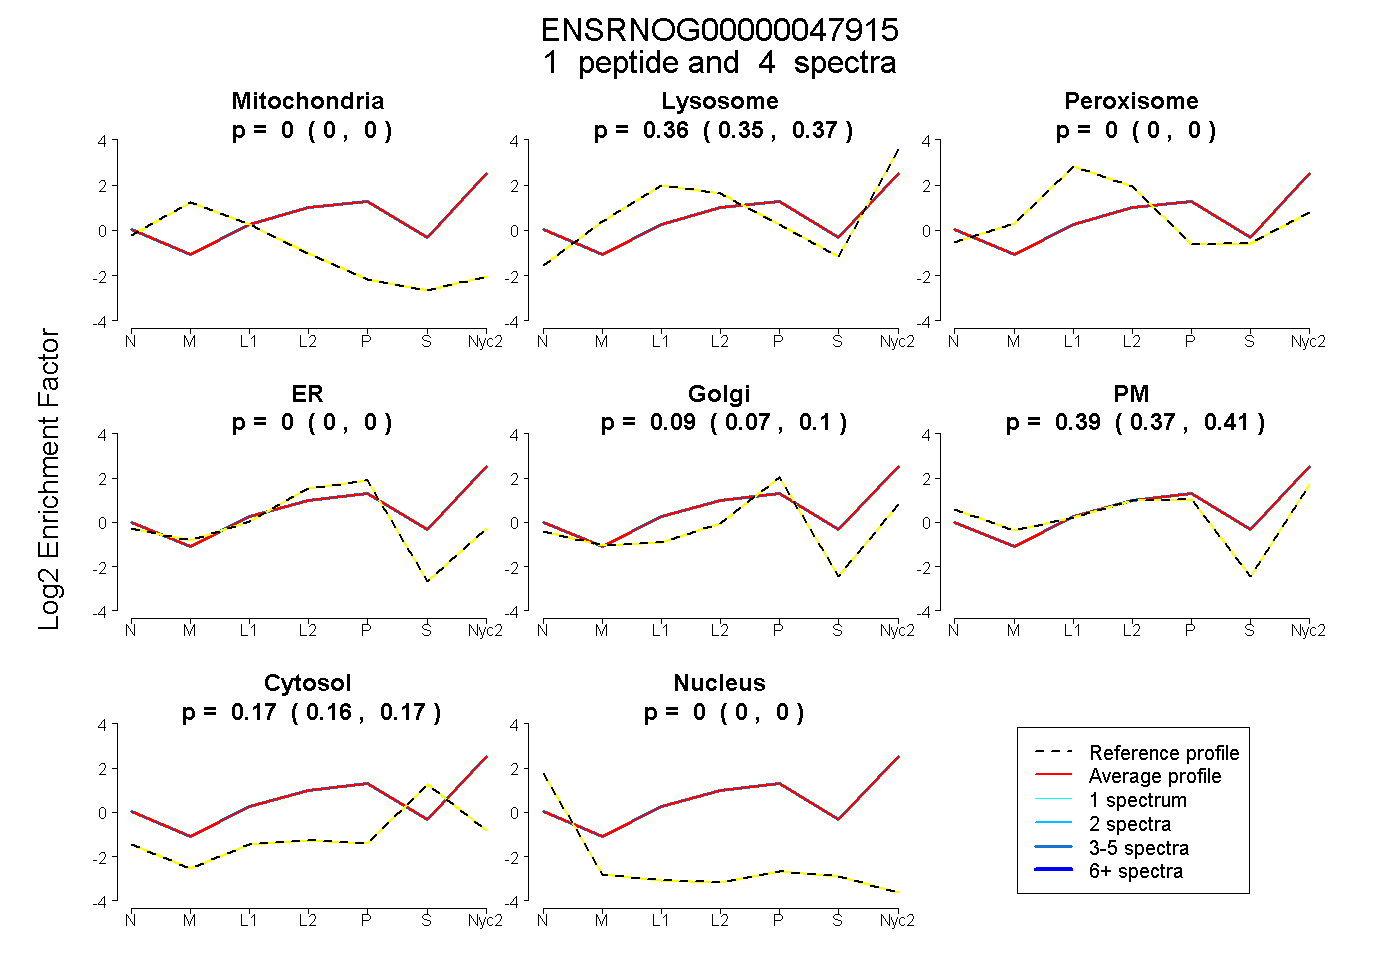
| Expt A |
1 peptide |
4 spectra |
|
0.000 0.000 | 0.000 |
0.356 0.345 | 0.366 |
0.000 0.000 | 0.000 |
0.000 0.000 | 0.000 |
0.087 0.066 | 0.103 |
0.390 0.366 | 0.411 |
0.166 0.160 | 0.172 |
0.000 0.000 | 0.000 |
||
| Plot | Lyso | Other | |||||||||||
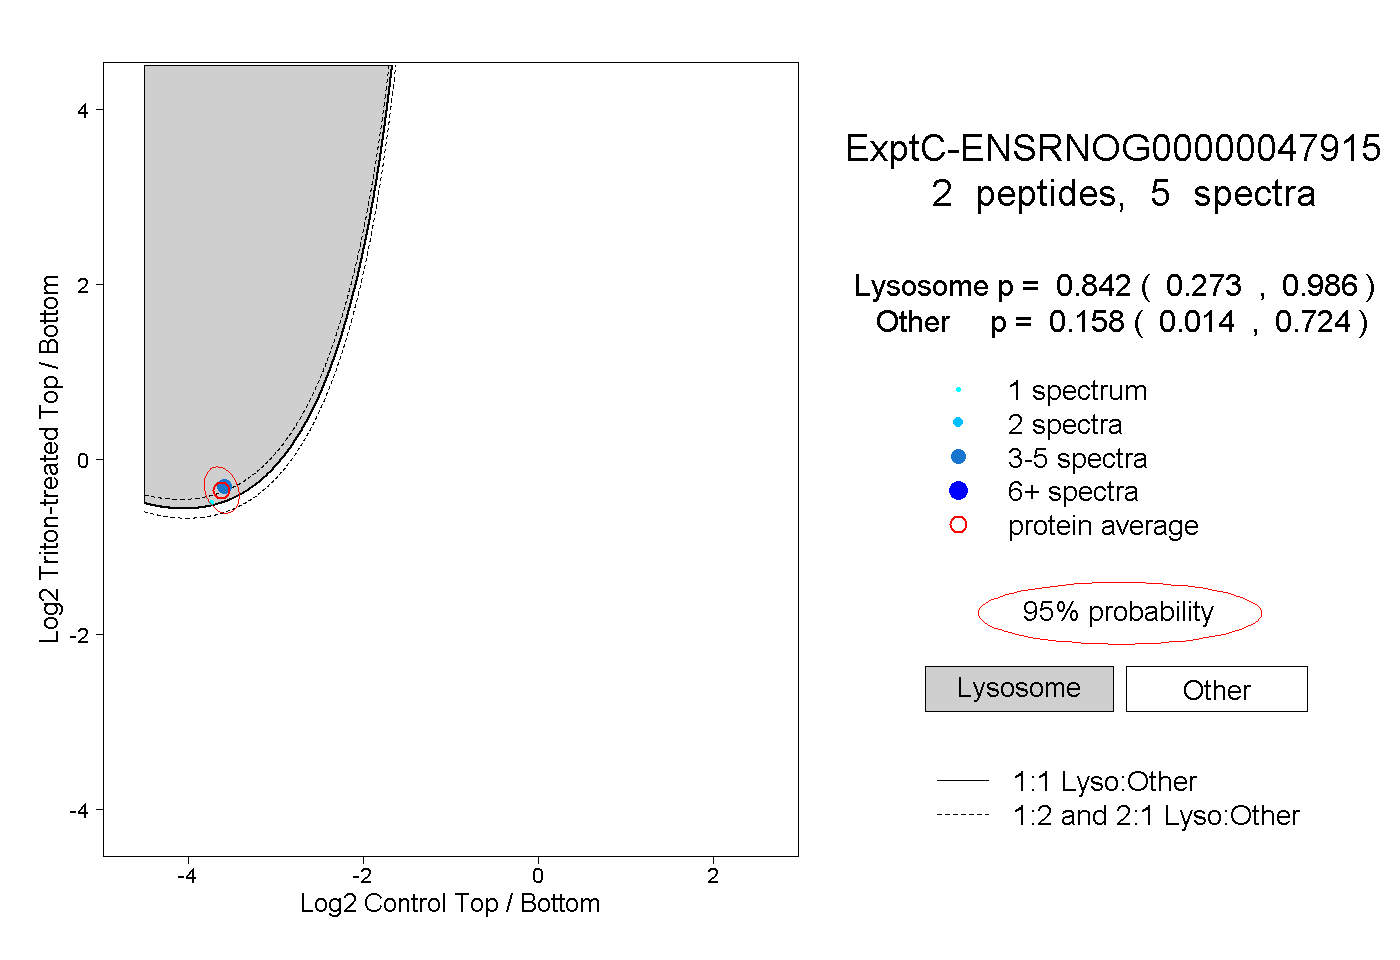
| Expt C |
2 peptides |
5 spectra |
|
0.842 0.273 | 0.986 |
0.158 0.014 | 0.724 |