 32
32peptides
spectra
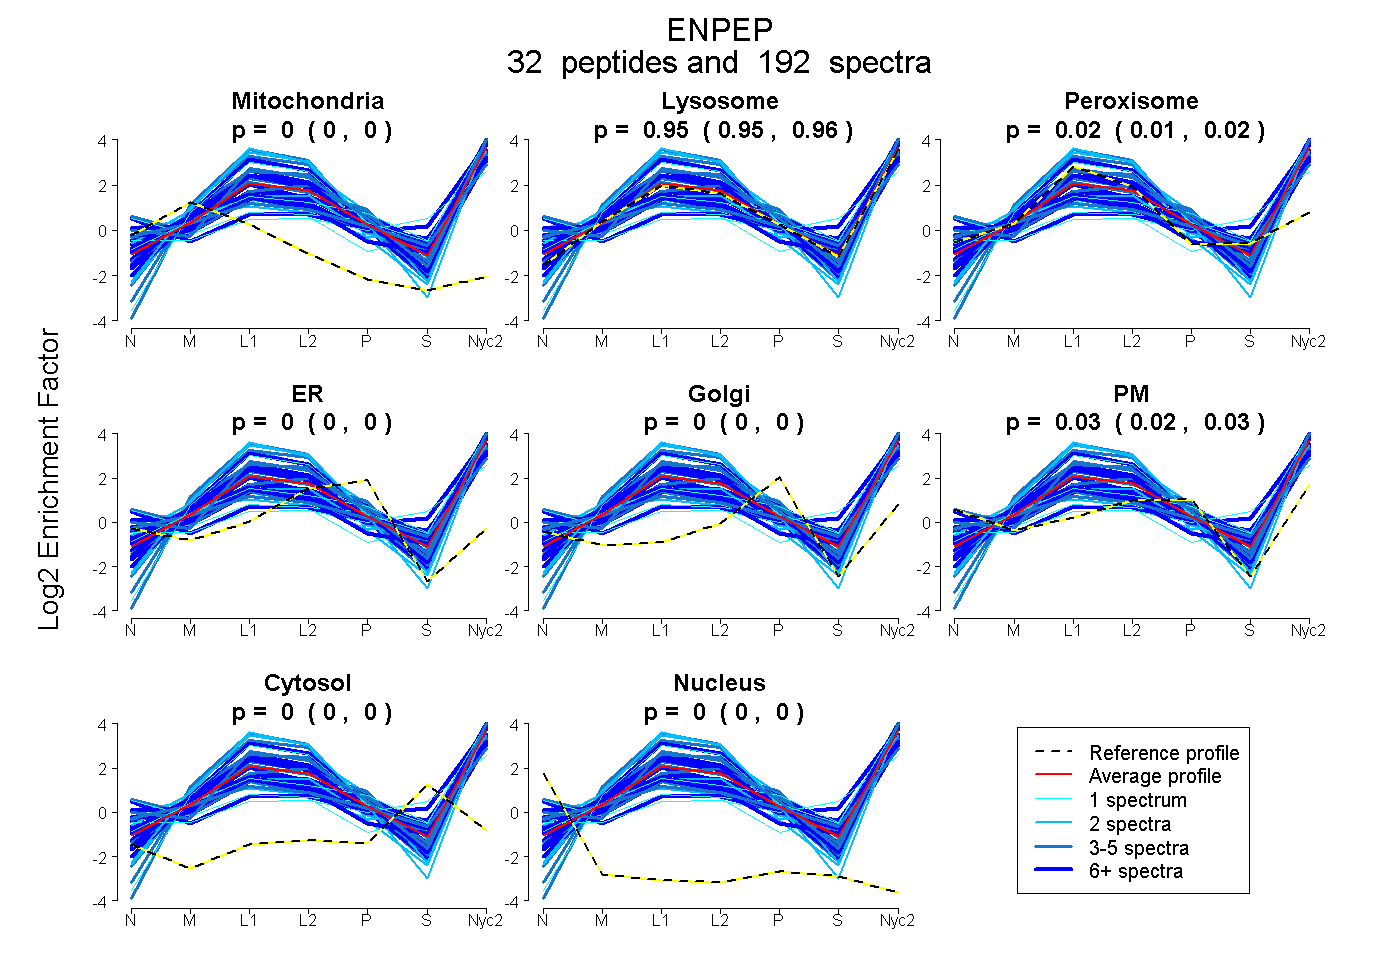
0.000 | 0.000
0.949 | 0.959
0.013 | 0.022
0.000 | 0.000
0.000 | 0.000
0.022 | 0.032
0.000 | 0.000
0.000 | 0.000
23peptides
spectra
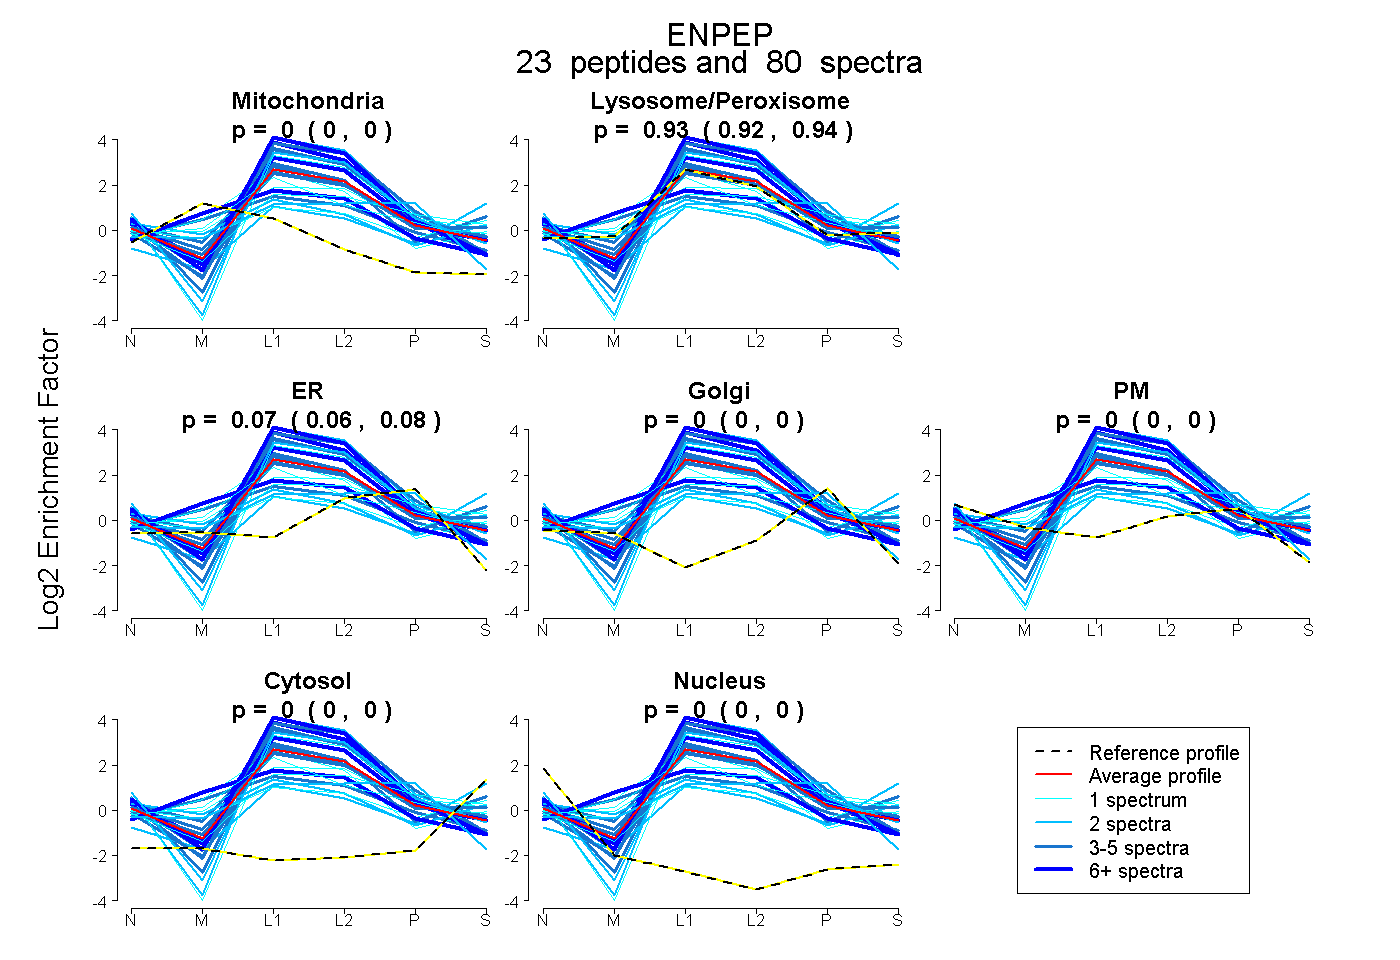
0.000 | 0.000
0.922 | 0.939
0.059 | 0.076
0.000 | 0.000
0.000 | 0.000
0.000 | 0.000
0.000 | 0.000
34peptides
spectra
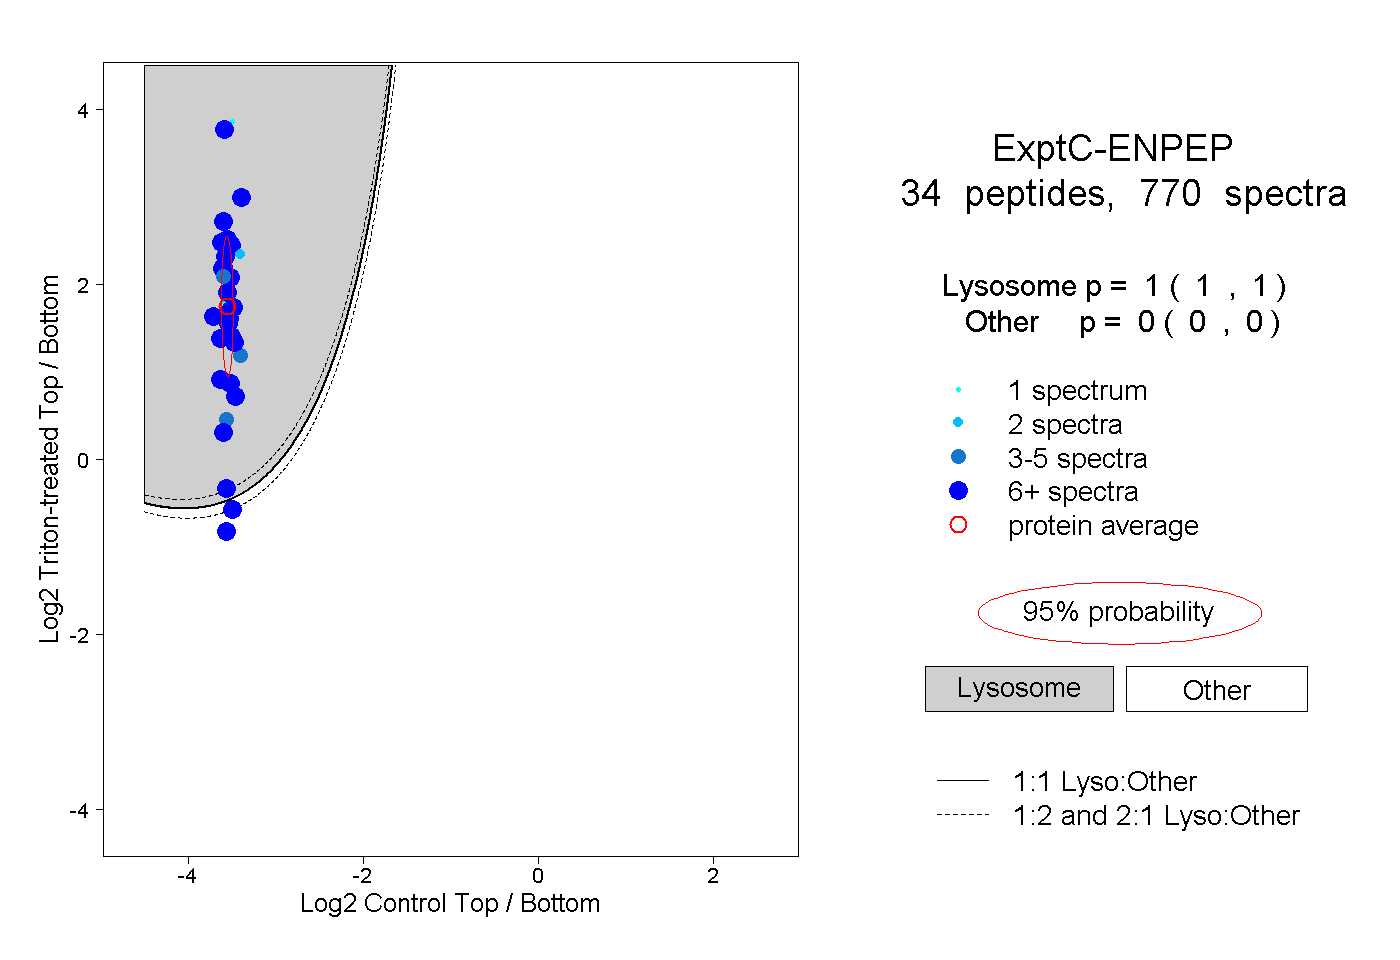
1.000 | 1.000
0.000 | 0.000
22peptides
spectra
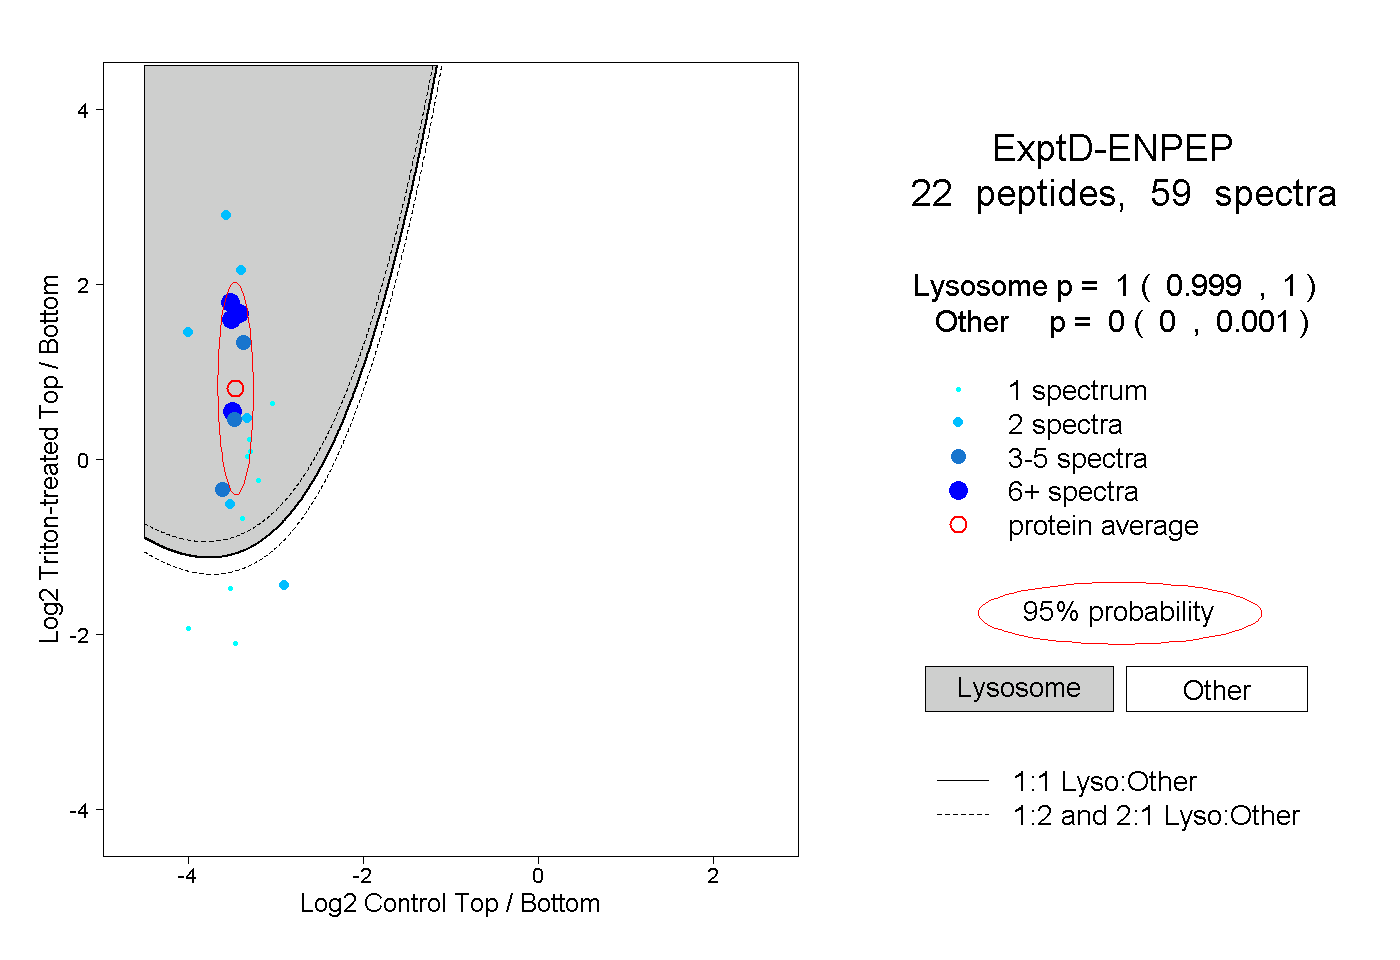
0.999 | 1.000
0.000 | 0.001