 6
6peptides
spectra
0.000 | 0.000
0.000 | 0.027
0.000 | 0.032
0.000 | 0.000
0.000 | 0.000
0.000 | 0.000
0.955 | 0.998
0.000 | 0.000
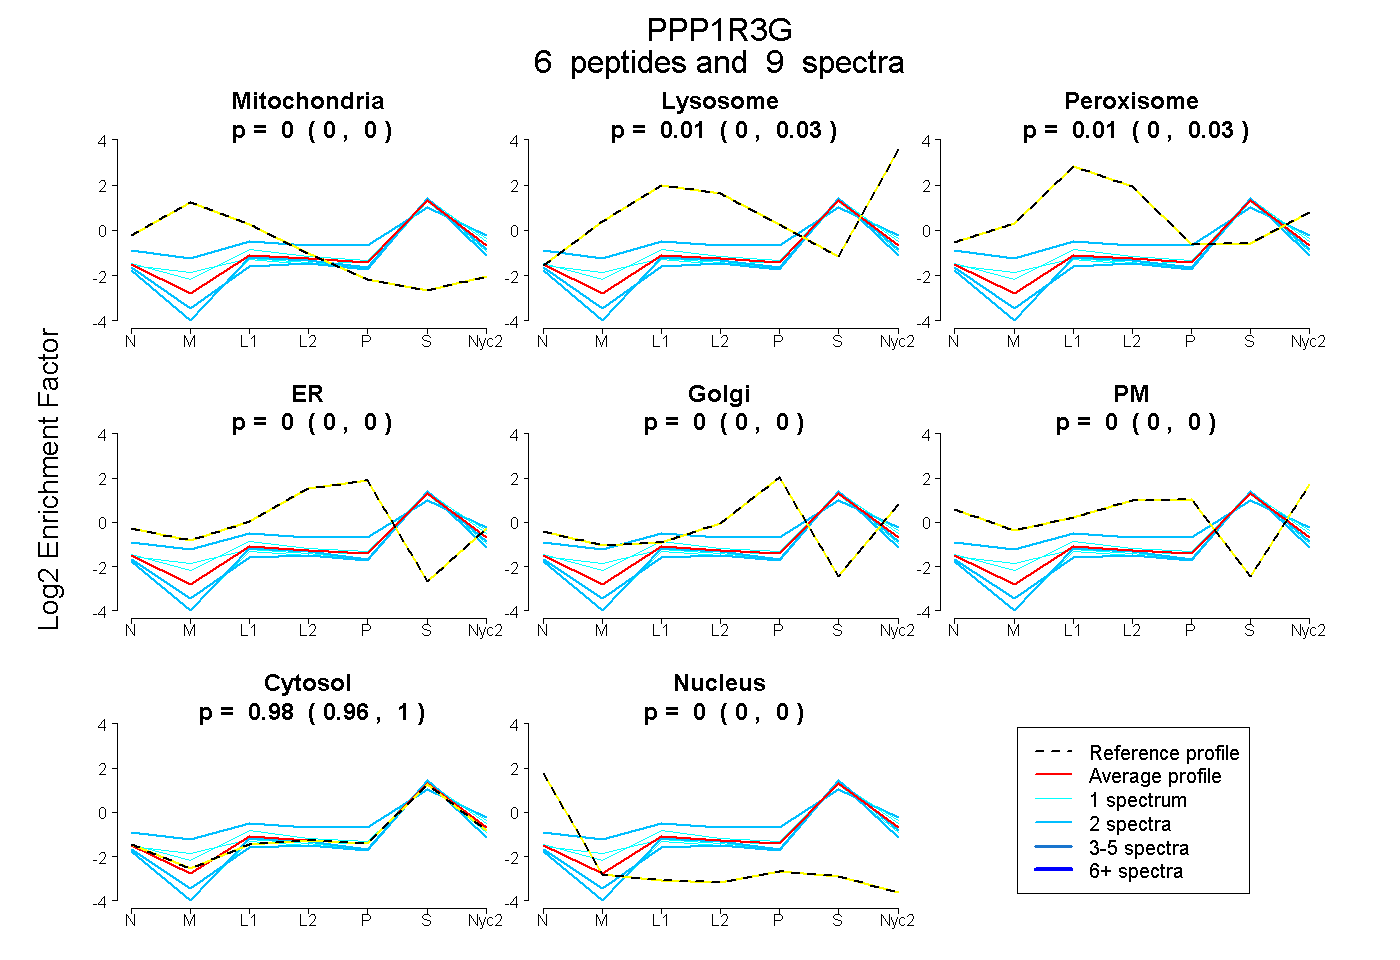
| Plot | Mito | Lyso | Perox | ER | Golgi | PM | Cytosol | Nucleus | |||||
| Expt A |
6 peptides |
9 spectra |
|
0.000 0.000 | 0.000 |
0.013 0.000 | 0.027 |
0.007 0.000 | 0.032 |
0.000 0.000 | 0.000 |
0.000 0.000 | 0.000 |
0.000 0.000 | 0.000 |
0.980 0.955 | 0.998 |
0.000 0.000 | 0.000 |
| 2 spectra, VPAPLLTPR | 0.000 | 0.000 | 0.000 | 0.000 | 0.000 | 0.000 | 1.000 | 0.000 | ||
| 2 spectra, VQCSQPPR | 0.000 | 0.000 | 0.000 | 0.000 | 0.000 | 0.000 | 0.982 | 0.018 | ||
| 1 spectrum, TFLDVPAELHPESLEPLSPVR | 0.015 | 0.000 | 0.078 | 0.000 | 0.000 | 0.000 | 0.906 | 0.000 | ||
| 1 spectrum, LHSFPLR | 0.034 | 0.057 | 0.000 | 0.000 | 0.000 | 0.000 | 0.909 | 0.000 | ||
| 2 spectra, AQLRPLFQLPGLIAAEER | 0.005 | 0.025 | 0.207 | 0.000 | 0.063 | 0.007 | 0.693 | 0.000 | ||
| 1 spectrum, AEDLQQLGELLAVAK | 0.000 | 0.000 | 0.000 | 0.000 | 0.000 | 0.000 | 1.000 | 0.000 |