 5
5peptides
spectra
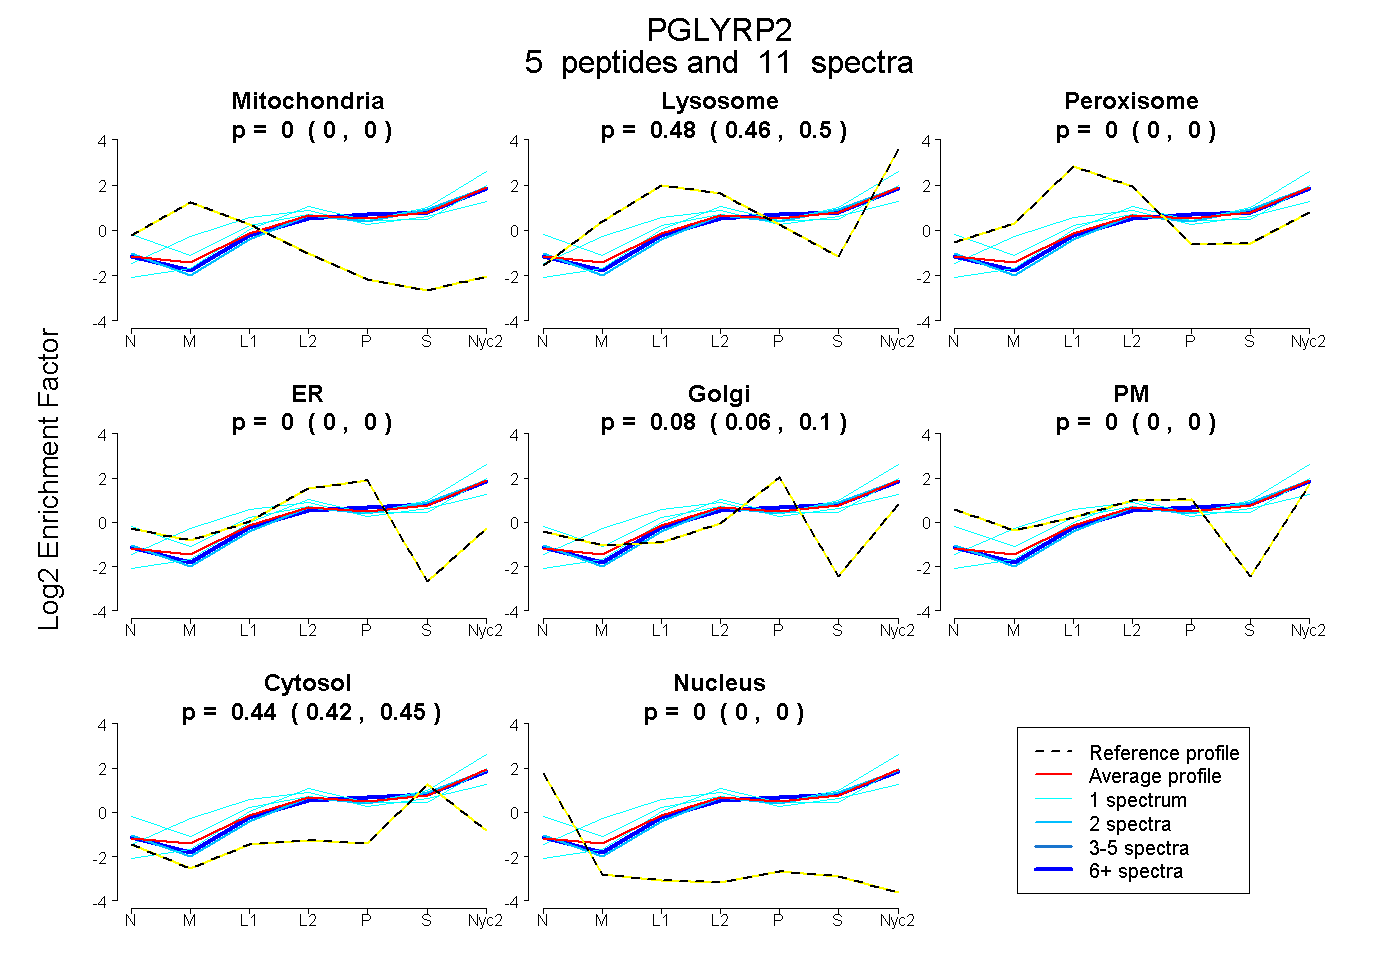
0.000 | 0.000
0.461 | 0.498
0.000 | 0.000
0.000 | 0.000
0.062 | 0.098
0.000 | 0.000
0.423 | 0.450
0.000 | 0.000
1peptide
spectrum
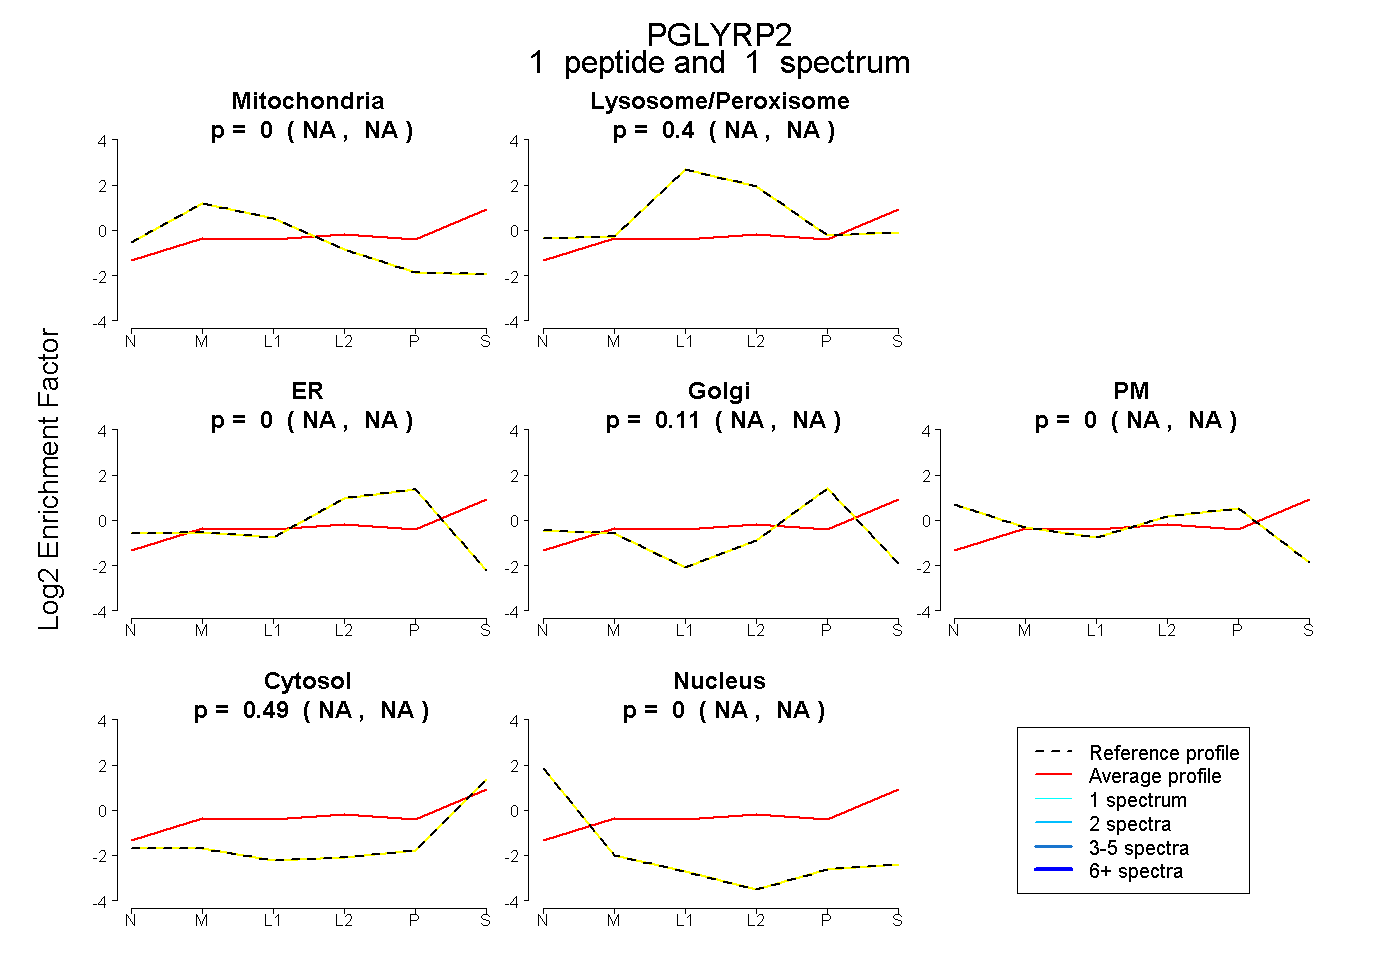
NA | NA
NA | NA
NA | NA
NA | NA
NA | NA
NA | NA
NA | NA
7peptides
spectra
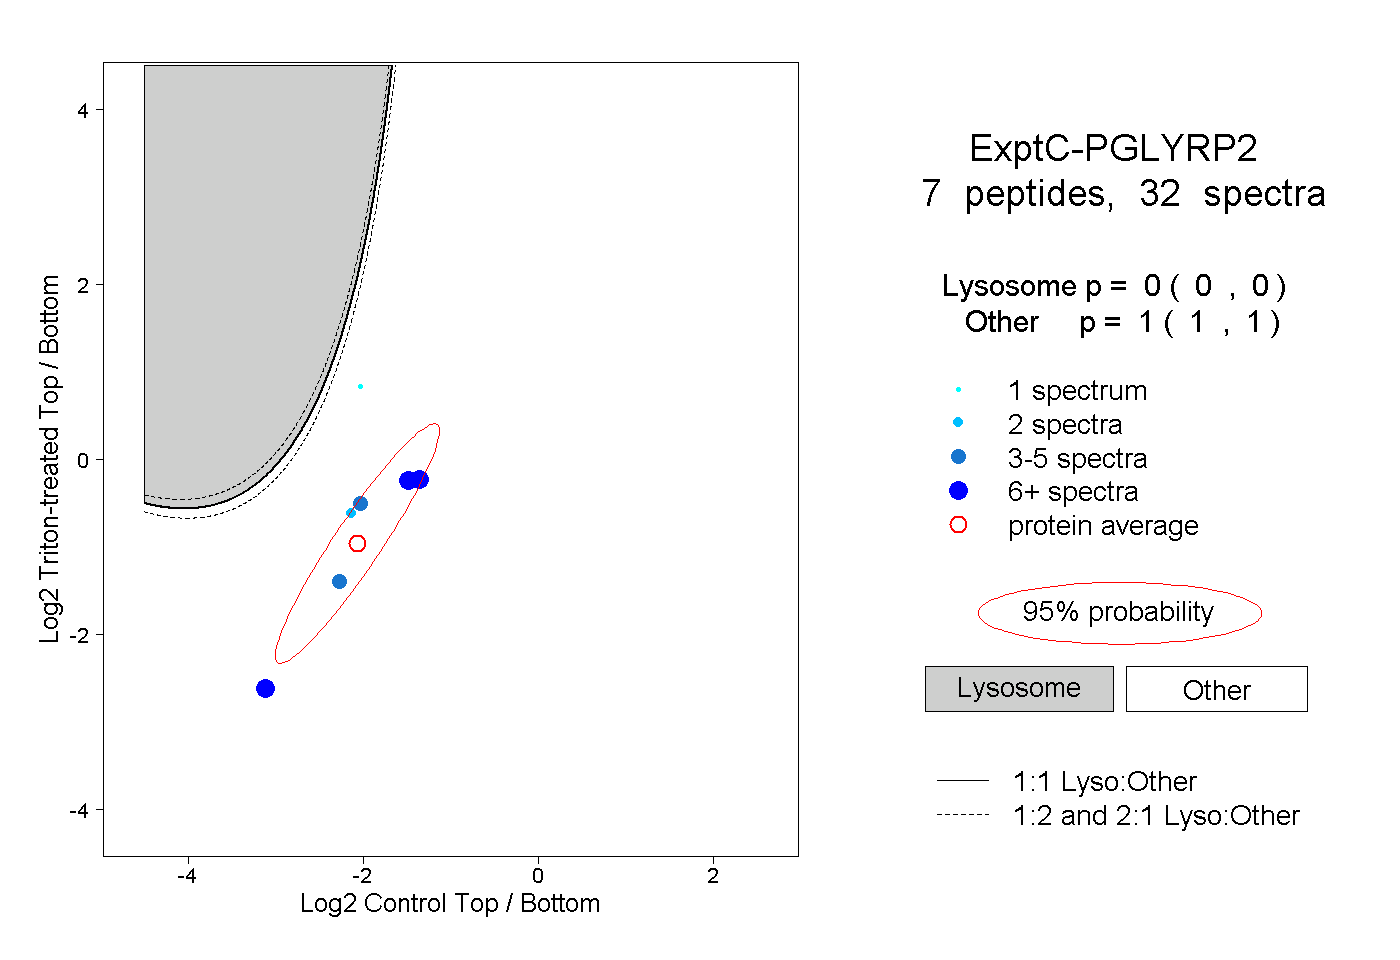
0.000 | 0.000
1.000 | 1.000
2peptides
spectra
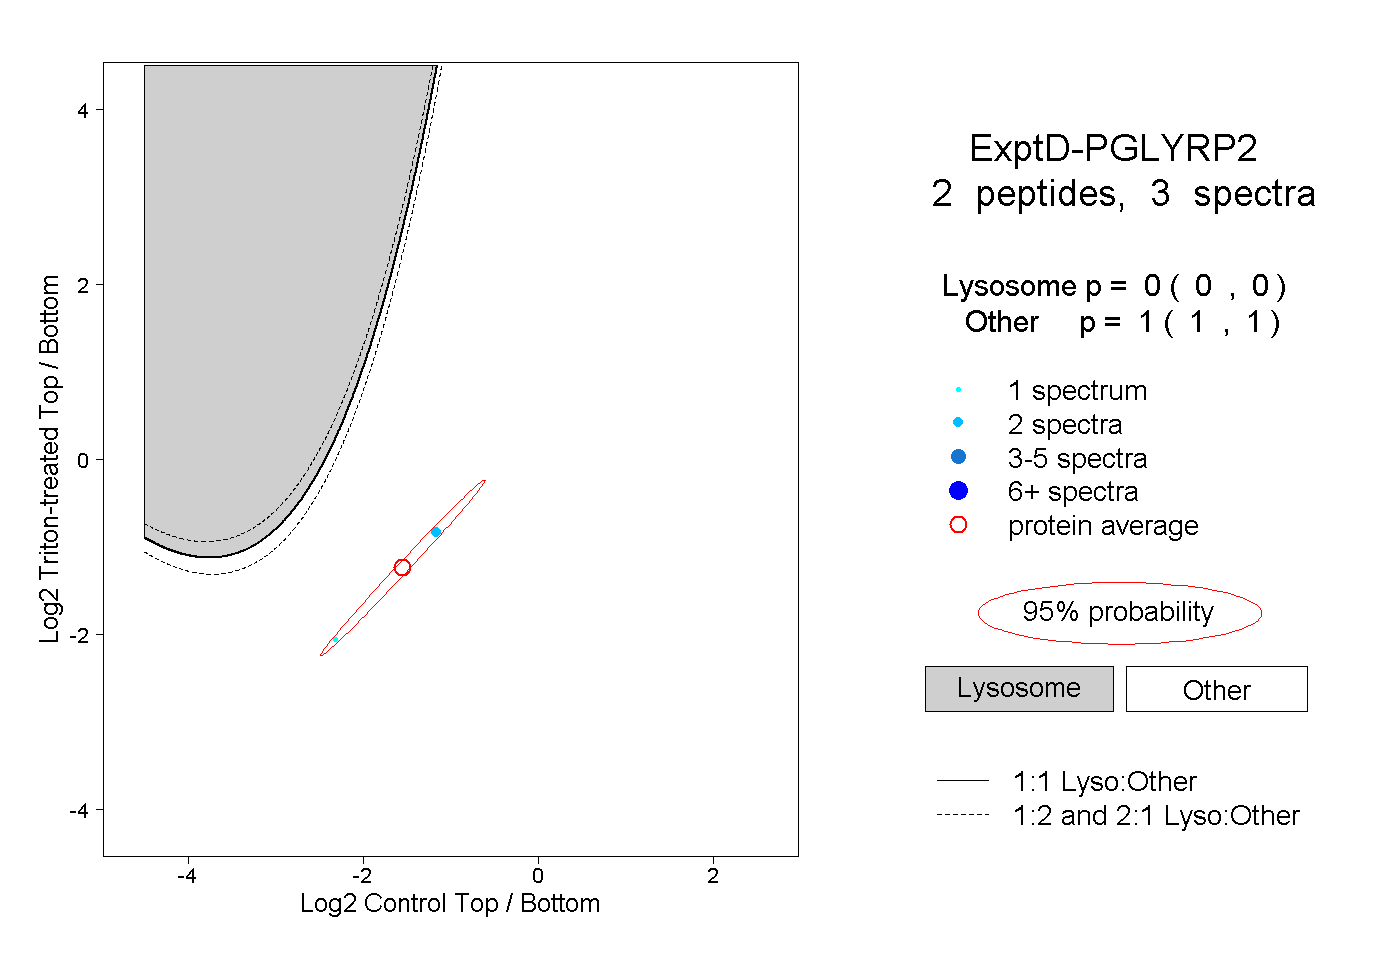
0.000 | 0.000
1.000 | 1.000