 5
5peptides
spectra
0.000 | 0.000
0.461 | 0.498
0.000 | 0.000
0.000 | 0.000
0.062 | 0.098
0.000 | 0.000
0.423 | 0.450
0.000 | 0.000
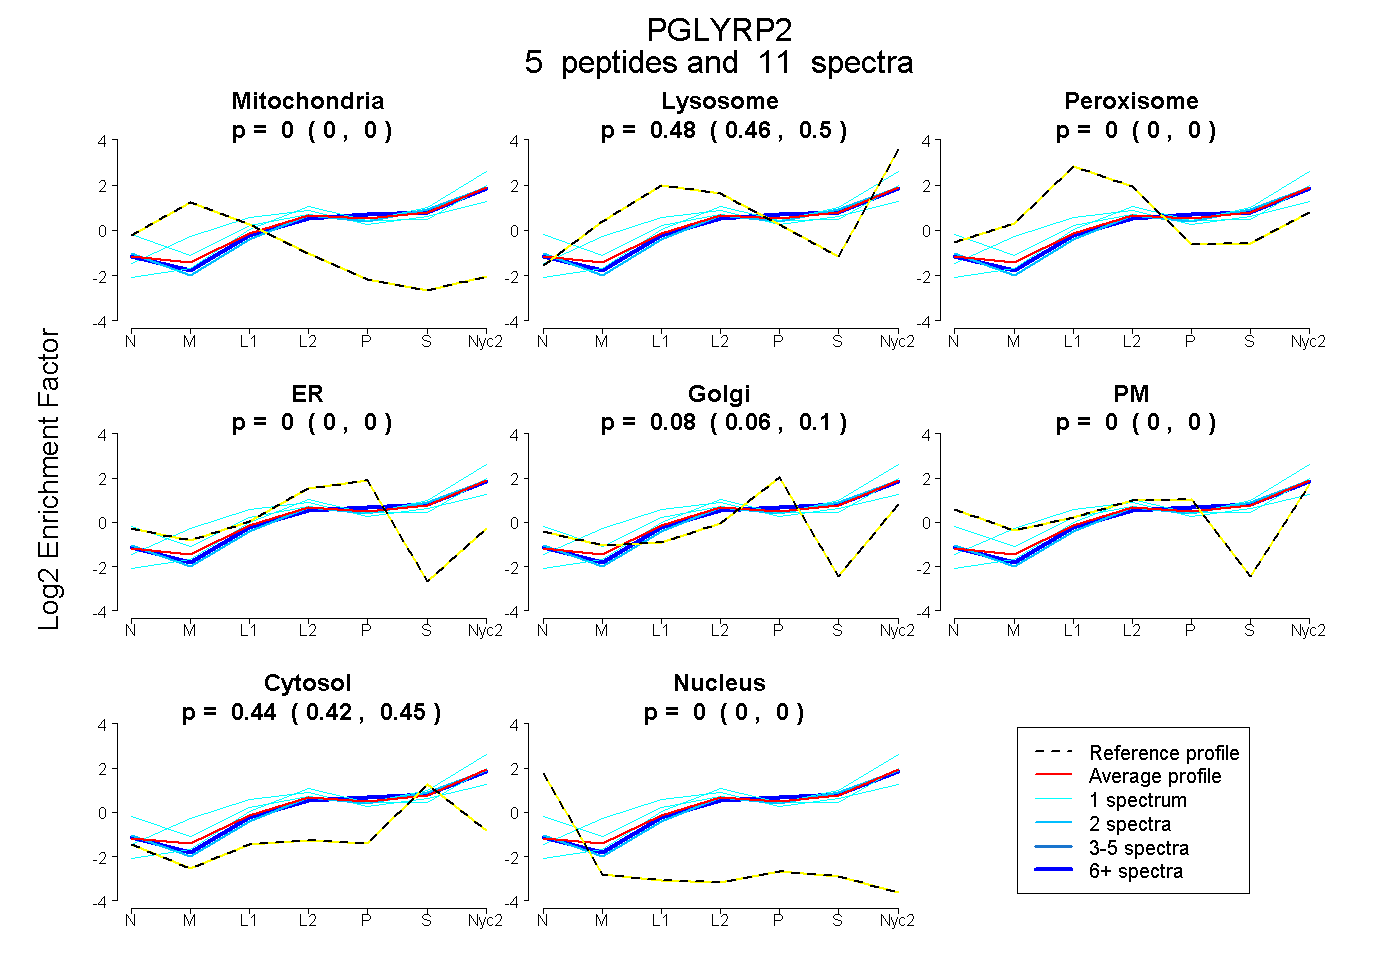
| Plot | Mito | Lyso | Perox | ER | Golgi | PM | Cytosol | Nucleus | |||||
| Expt A |
5 peptides |
11 spectra |
|
0.000 0.000 | 0.000 |
0.481 0.461 | 0.498 |
0.000 0.000 | 0.000 |
0.000 0.000 | 0.000 |
0.082 0.062 | 0.098 |
0.000 0.000 | 0.000 |
0.438 0.423 | 0.450 |
0.000 0.000 | 0.000 |
| 1 spectrum, VFTLLDHK | 0.000 | 0.584 | 0.000 | 0.000 | 0.000 | 0.000 | 0.416 | 0.000 | ||
| 6 spectra, IPKPHPPLSR | 0.000 | 0.420 | 0.000 | 0.000 | 0.129 | 0.000 | 0.451 | 0.000 | ||
| 1 spectrum, EFTEAFLGCPAIHPR | 0.000 | 0.456 | 0.142 | 0.034 | 0.000 | 0.000 | 0.368 | 0.000 | ||
| 2 spectra, TPTTVDR | 0.000 | 0.421 | 0.000 | 0.000 | 0.084 | 0.000 | 0.495 | 0.000 | ||
| 1 spectrum, LQNMSQK | 0.000 | 0.386 | 0.000 | 0.000 | 0.000 | 0.256 | 0.358 | 0.000 |
| Plot | Mito | Lyso or Perox | ER | Golgi | PM | Cytosol | Nucleus | ||||||
| Expt B |
1 peptide |
1 spectrum |
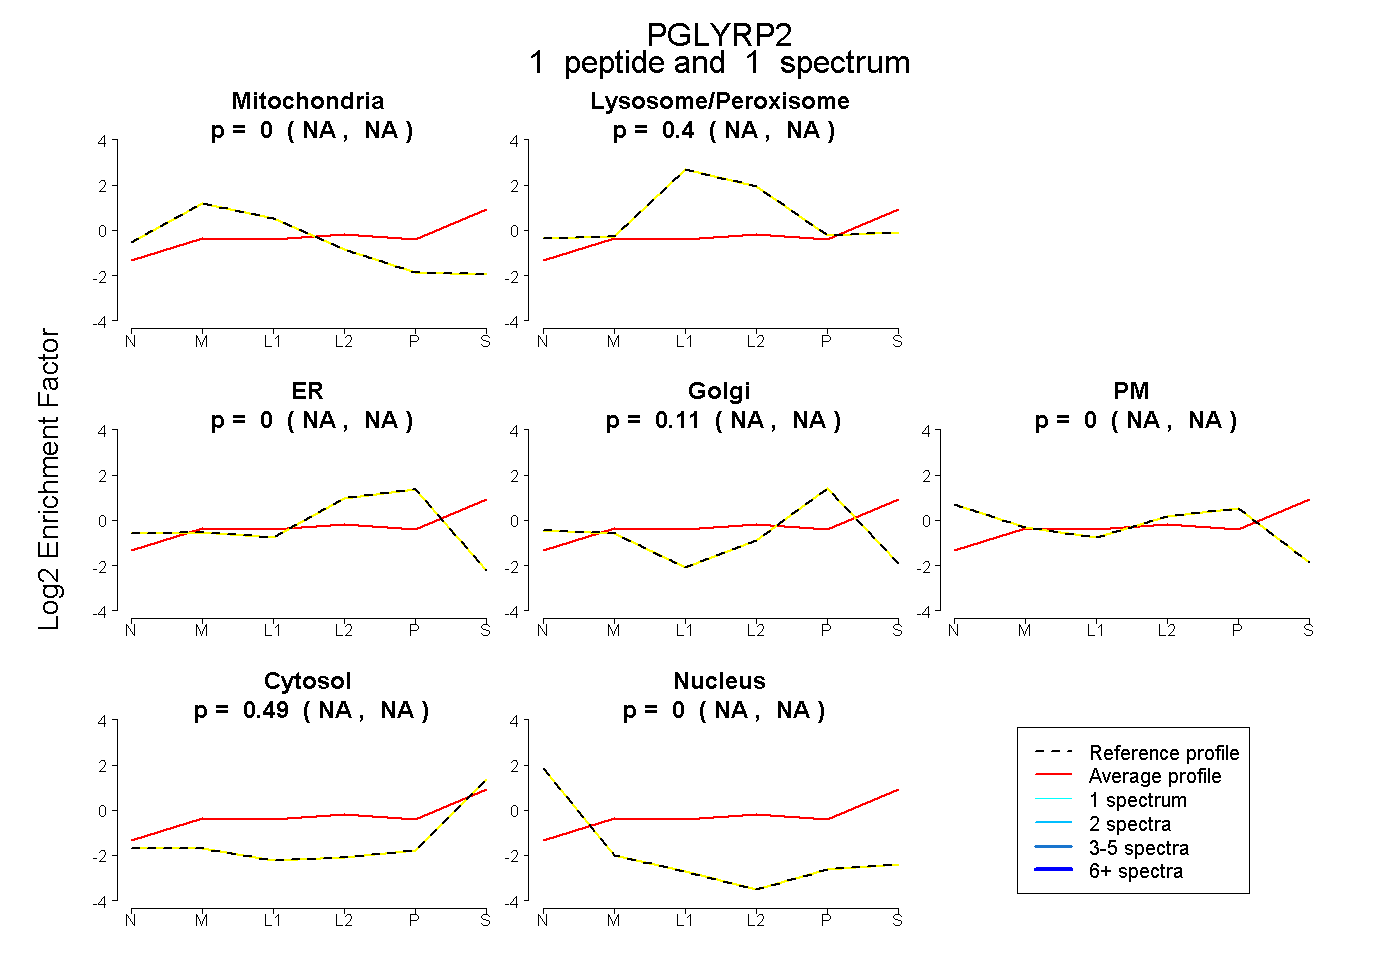 |
0.000 NA | NA |
0.403 NA | NA |
0.000 NA | NA |
0.111 NA | NA |
0.000 NA | NA |
0.486 NA | NA |
0.000 NA | NA |
|||
| Plot | Lyso | Other | |||||||||||
| Expt C |
7 peptides |
32 spectra |
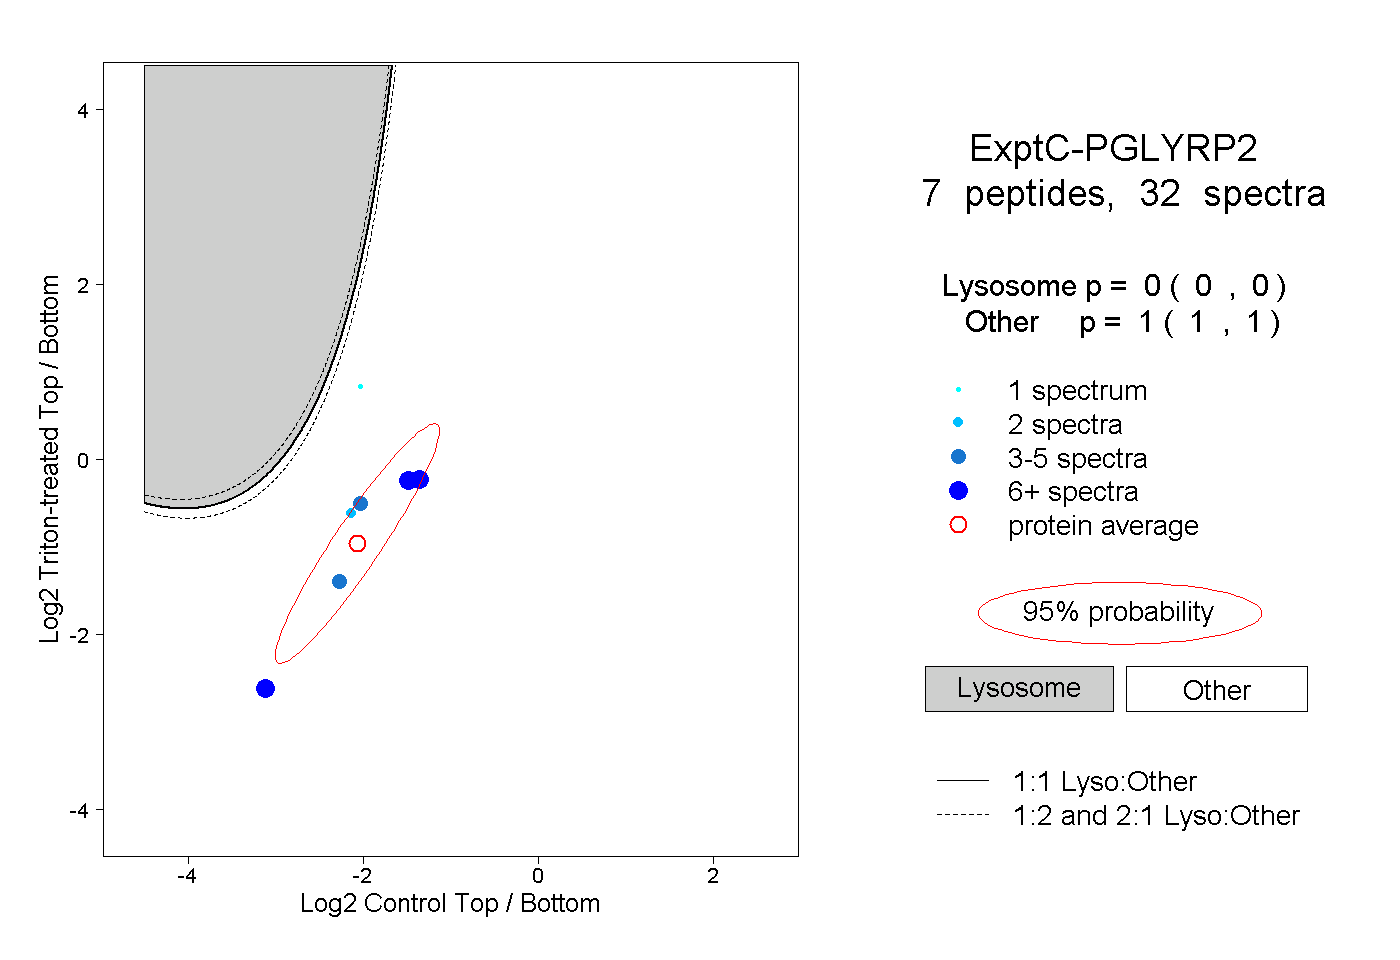 |
0.000 0.000 | 0.000 |
1.000 1.000 | 1.000 |
||||||||
| Plot | Lyso | Other | |||||||||||
| Expt D |
2 peptides |
3 spectra |
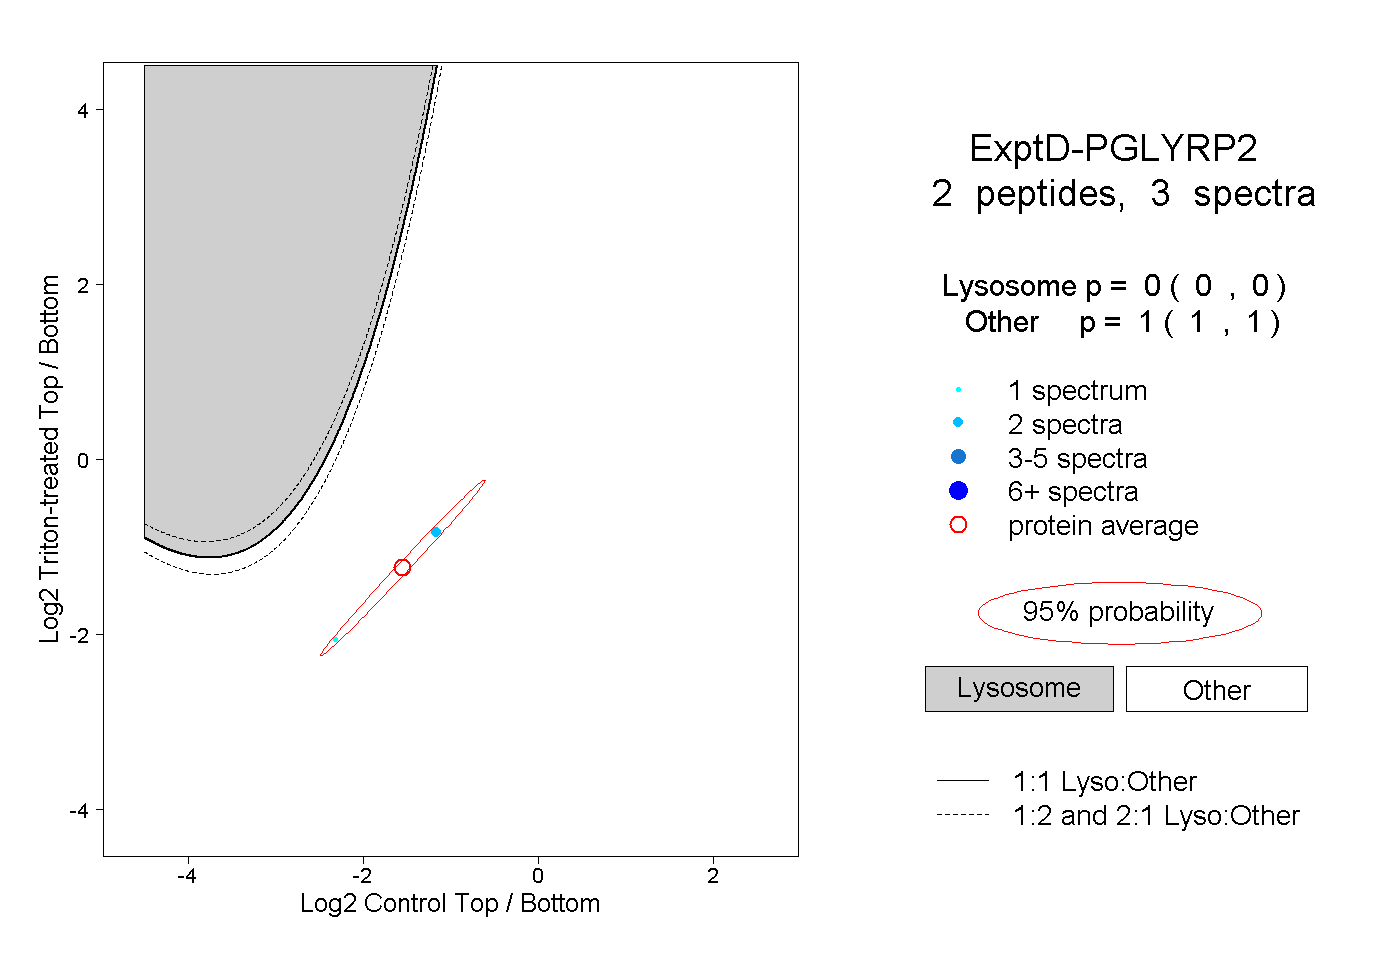 |
0.000 0.000 | 0.000 |
1.000 1.000 | 1.000 |