10
10peptides
spectra
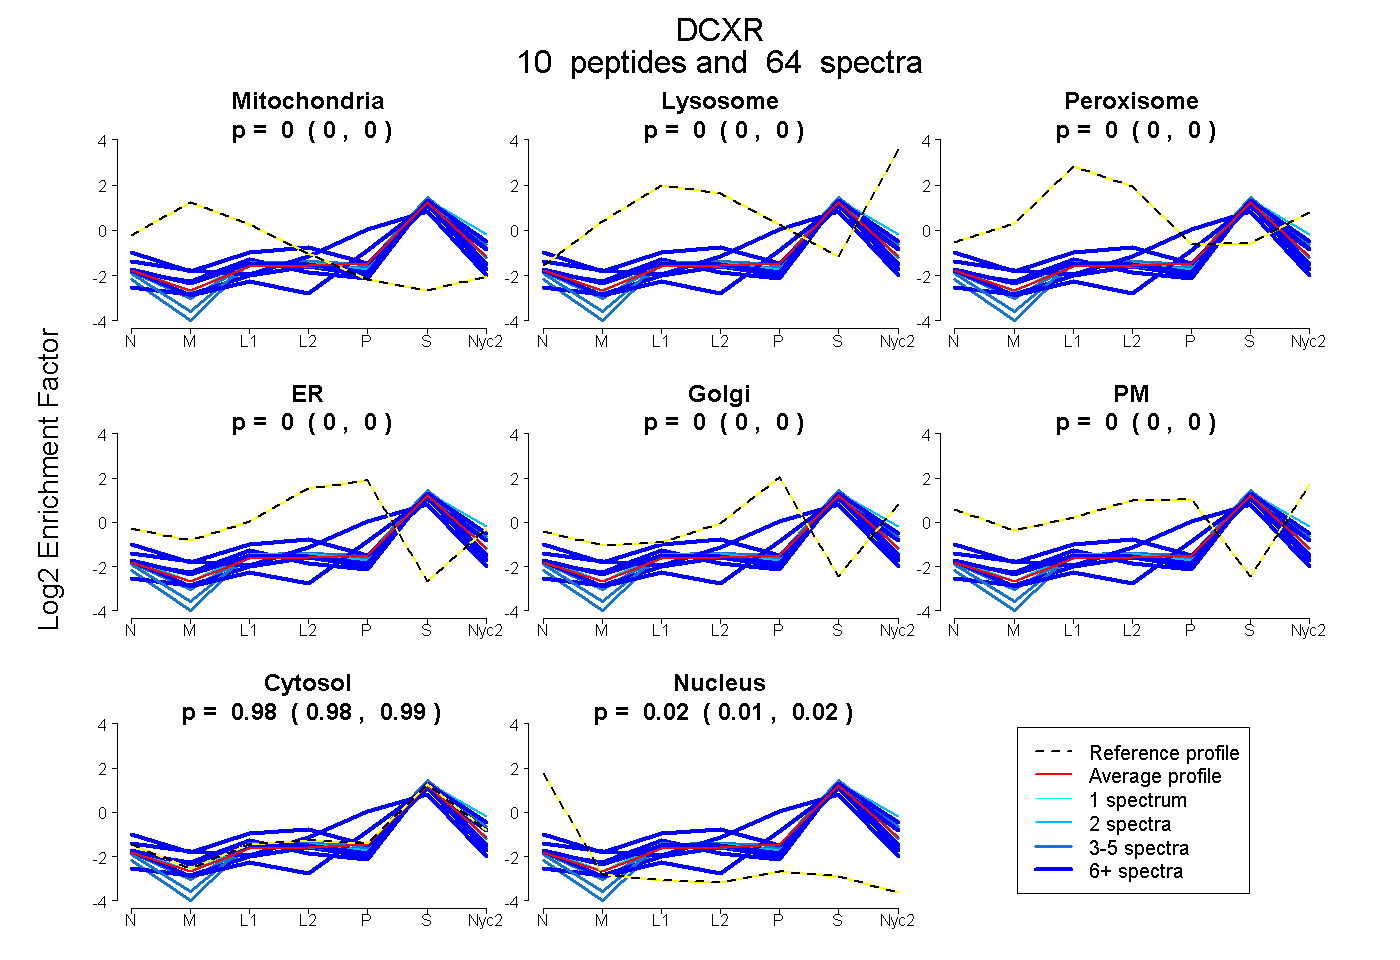
0.000 | 0.000
0.000 | 0.000
0.000 | 0.000
0.000 | 0.000
0.000 | 0.000
0.000 | 0.000
0.976 | 0.986
0.014 | 0.023
8peptides
spectra
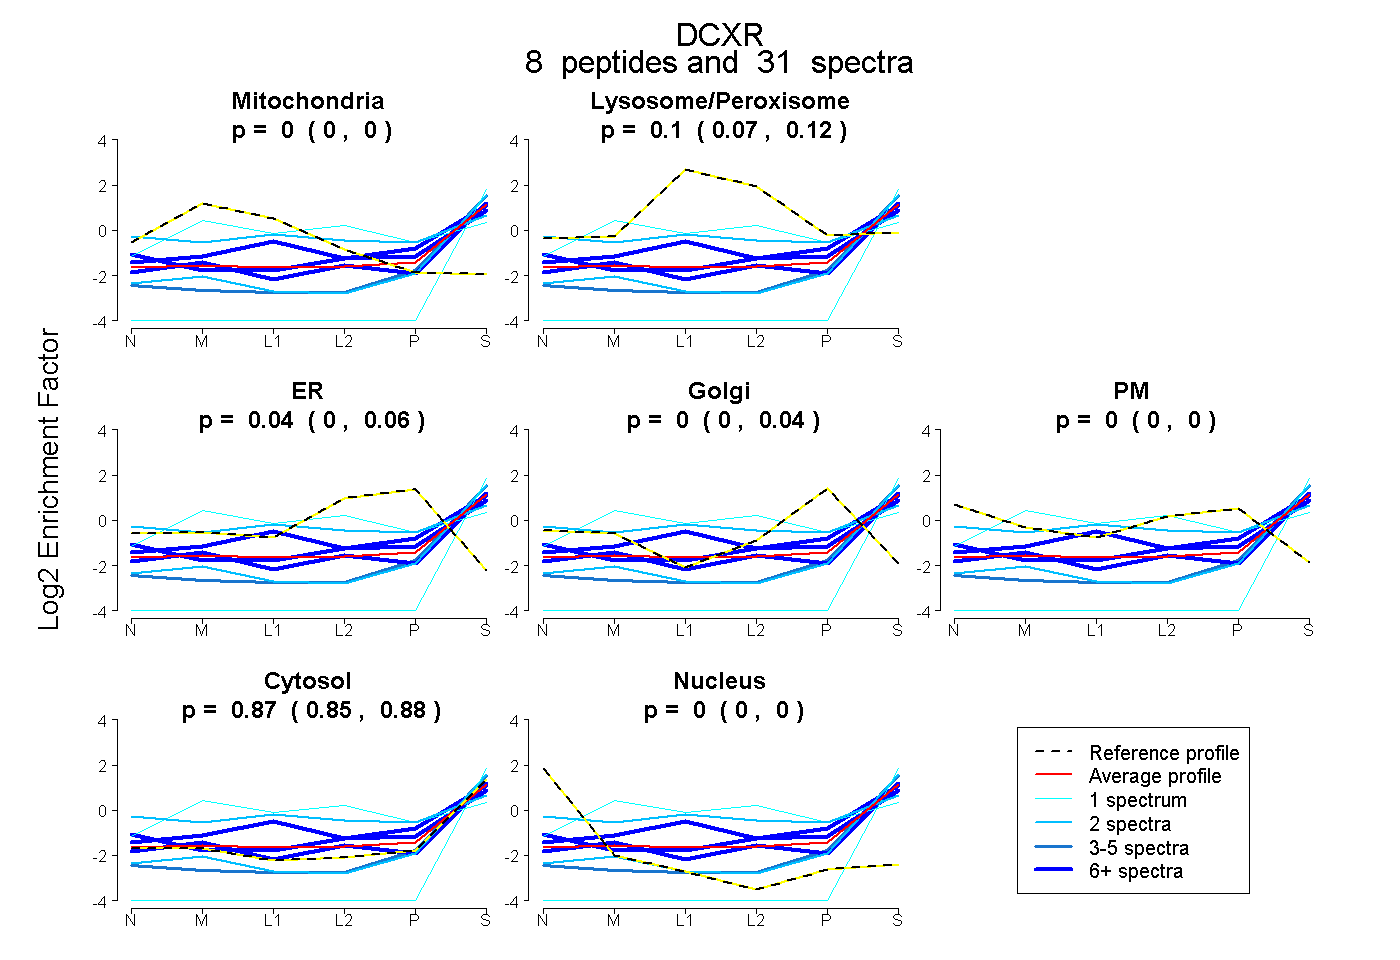
0.000 | 0.000
0.067 | 0.123
0.000 | 0.056
0.000 | 0.036
0.000 | 0.000
0.847 | 0.878
0.000 | 0.000