 10
10peptides
spectra
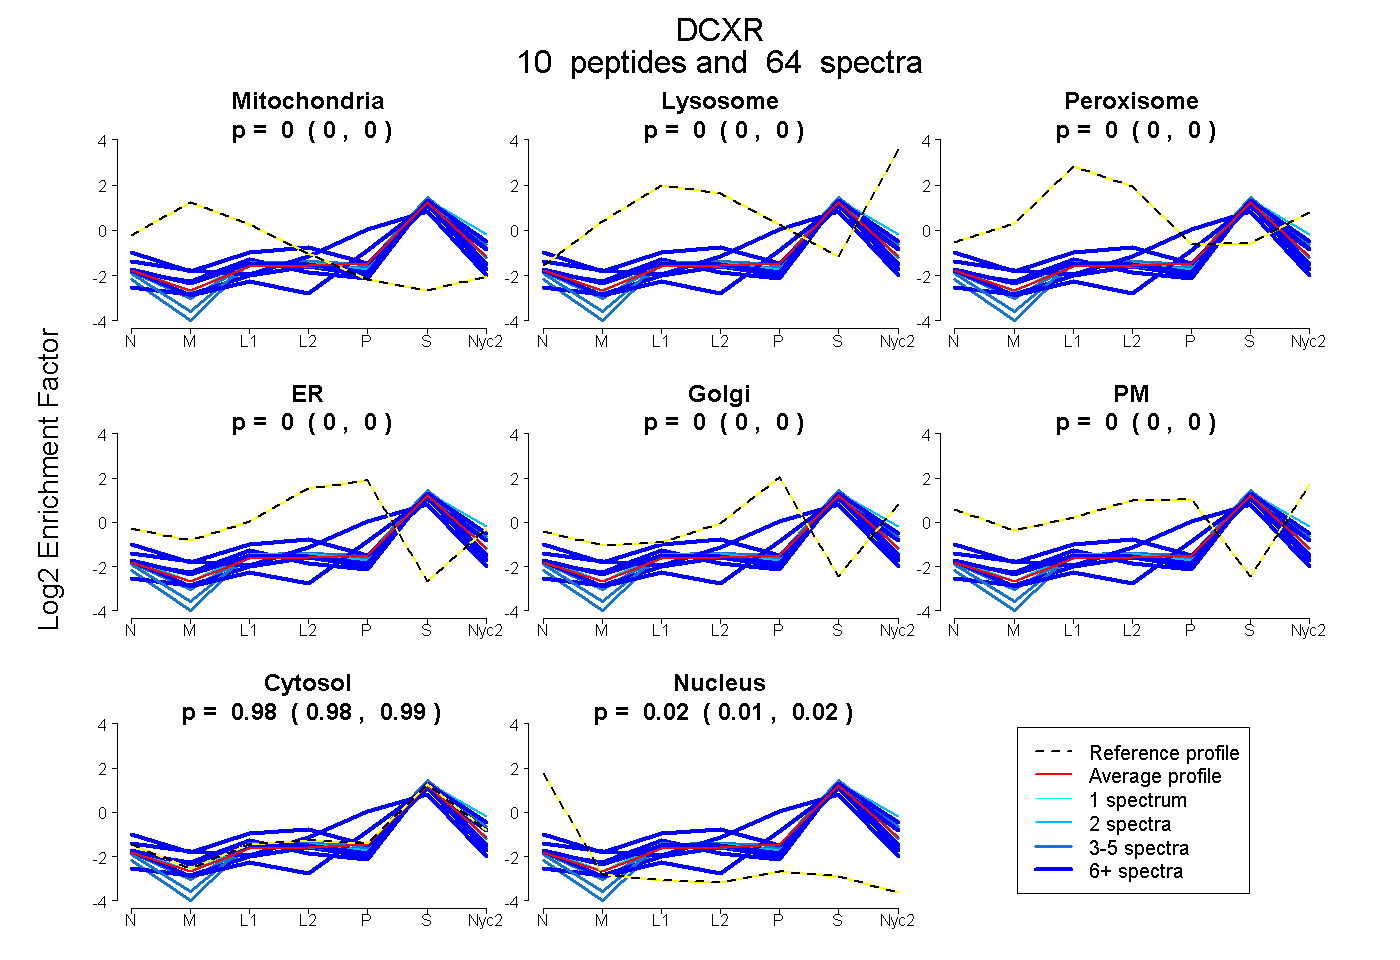
0.000 | 0.000
0.000 | 0.000
0.000 | 0.000
0.000 | 0.000
0.000 | 0.000
0.000 | 0.000
0.976 | 0.986
0.014 | 0.023
| Plot | Mito | Lyso | Perox | ER | Golgi | PM | Cytosol | Nucleus | |||||
| Expt A |
10 peptides |
64 spectra |
|
0.000 0.000 | 0.000 |
0.000 0.000 | 0.000 |
0.000 0.000 | 0.000 |
0.000 0.000 | 0.000 |
0.000 0.000 | 0.000 |
0.000 0.000 | 0.000 |
0.981 0.976 | 0.986 |
0.019 0.014 | 0.023 |
| 10 spectra, AVVQVSQIVAR | 0.000 | 0.000 | 0.000 | 0.000 | 0.000 | 0.000 | 0.989 | 0.011 | ||
| 6 spectra, ALVTGAGK | 0.026 | 0.000 | 0.000 | 0.000 | 0.000 | 0.000 | 0.974 | 0.000 | ||
| 4 spectra, ALTNHTVYCSTK | 0.000 | 0.000 | 0.000 | 0.000 | 0.000 | 0.000 | 0.967 | 0.033 | ||
| 7 spectra, GVPGAIVNVSSQASQR | 0.000 | 0.000 | 0.000 | 0.000 | 0.000 | 0.000 | 0.874 | 0.126 | ||
| 11 spectra, VMALELGPHK | 0.000 | 0.006 | 0.000 | 0.000 | 0.000 | 0.000 | 0.994 | 0.000 | ||
| 7 spectra, GALDMLTK | 0.060 | 0.000 | 0.113 | 0.000 | 0.000 | 0.000 | 0.822 | 0.005 | ||
| 8 spectra, VNAVNPTVVMTPMGR | 0.000 | 0.000 | 0.000 | 0.156 | 0.000 | 0.000 | 0.779 | 0.065 | ||
| 2 spectra, EDLDSLVR | 0.000 | 0.020 | 0.000 | 0.000 | 0.000 | 0.000 | 0.980 | 0.000 | ||
| 5 spectra, EACDTSFNVNFR | 0.000 | 0.000 | 0.000 | 0.000 | 0.000 | 0.000 | 0.996 | 0.004 | ||
| 4 spectra, ANWSDPHK | 0.000 | 0.000 | 0.000 | 0.000 | 0.000 | 0.000 | 1.000 | 0.000 |
| Plot | Mito | Lyso or Perox | ER | Golgi | PM | Cytosol | Nucleus | ||||||
| Expt B |
8 peptides |
31 spectra |
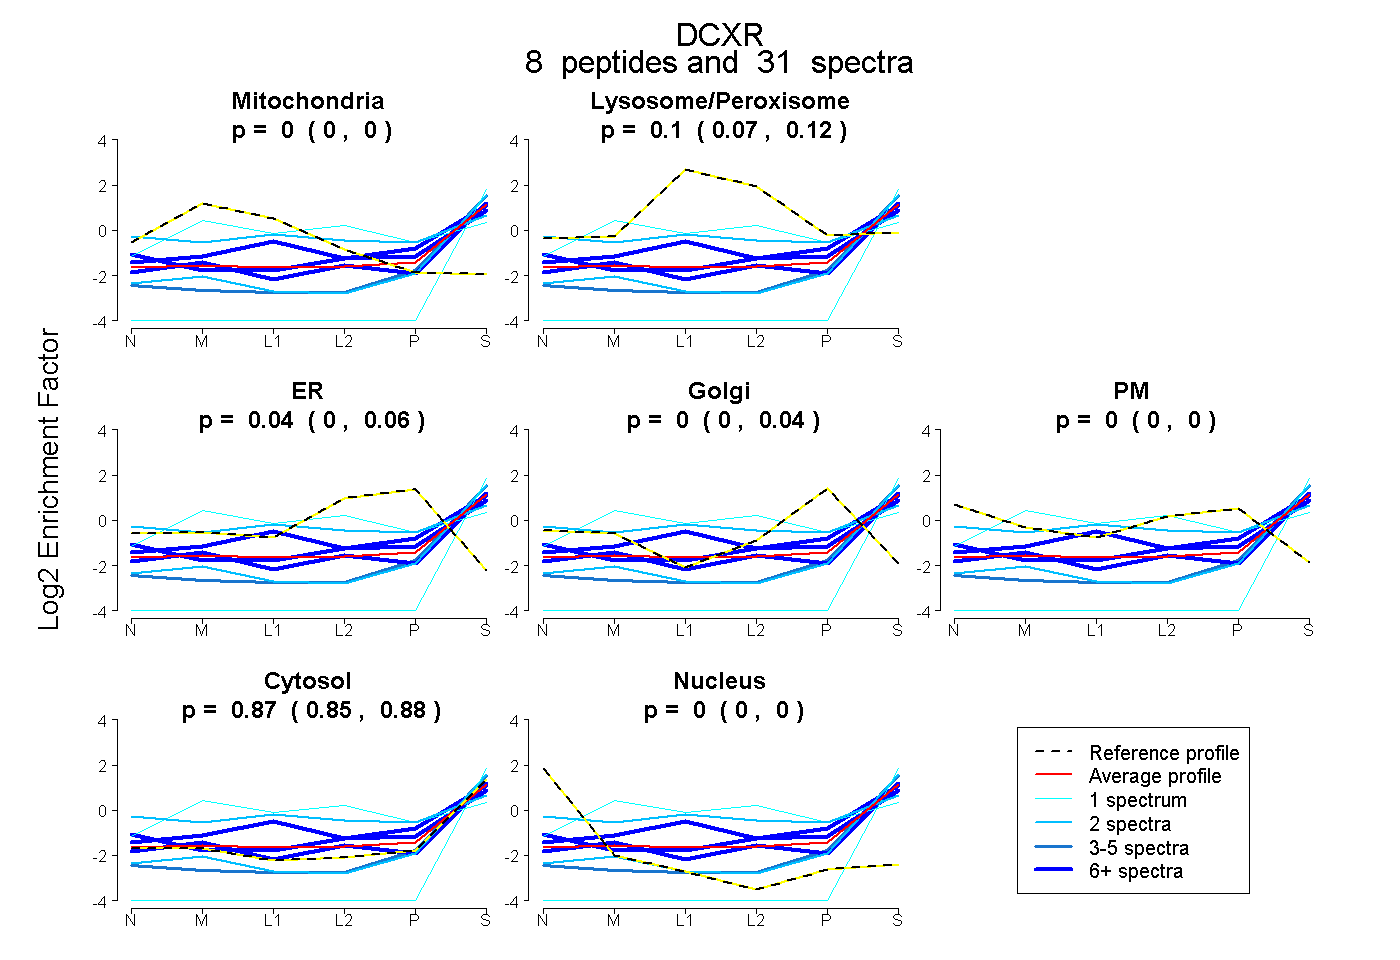 |
0.000 0.000 | 0.000 |
0.097 0.067 | 0.123 |
0.037 0.000 | 0.056 |
0.000 0.000 | 0.036 |
0.000 0.000 | 0.000 |
0.867 0.847 | 0.878 |
0.000 0.000 | 0.000 |
|||
| Plot | Lyso | Other | |||||||||||
| Expt C |
10 peptides |
72 spectra |
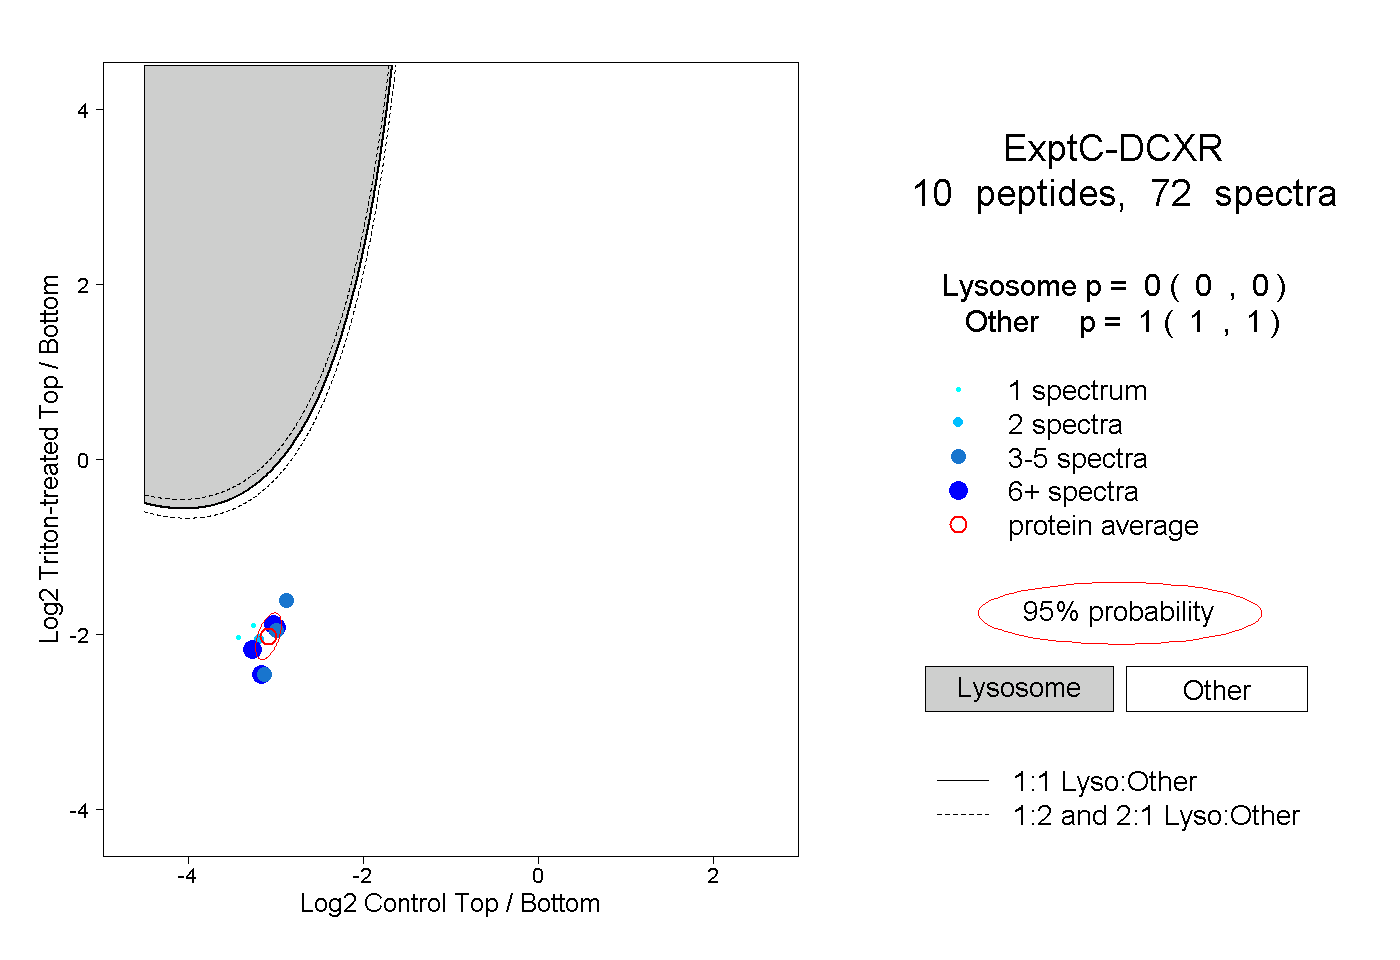 |
0.000 0.000 | 0.000 |
1.000 1.000 | 1.000 |
||||||||
| Plot | Lyso | Other | |||||||||||
| Expt D |
6 peptides |
11 spectra |
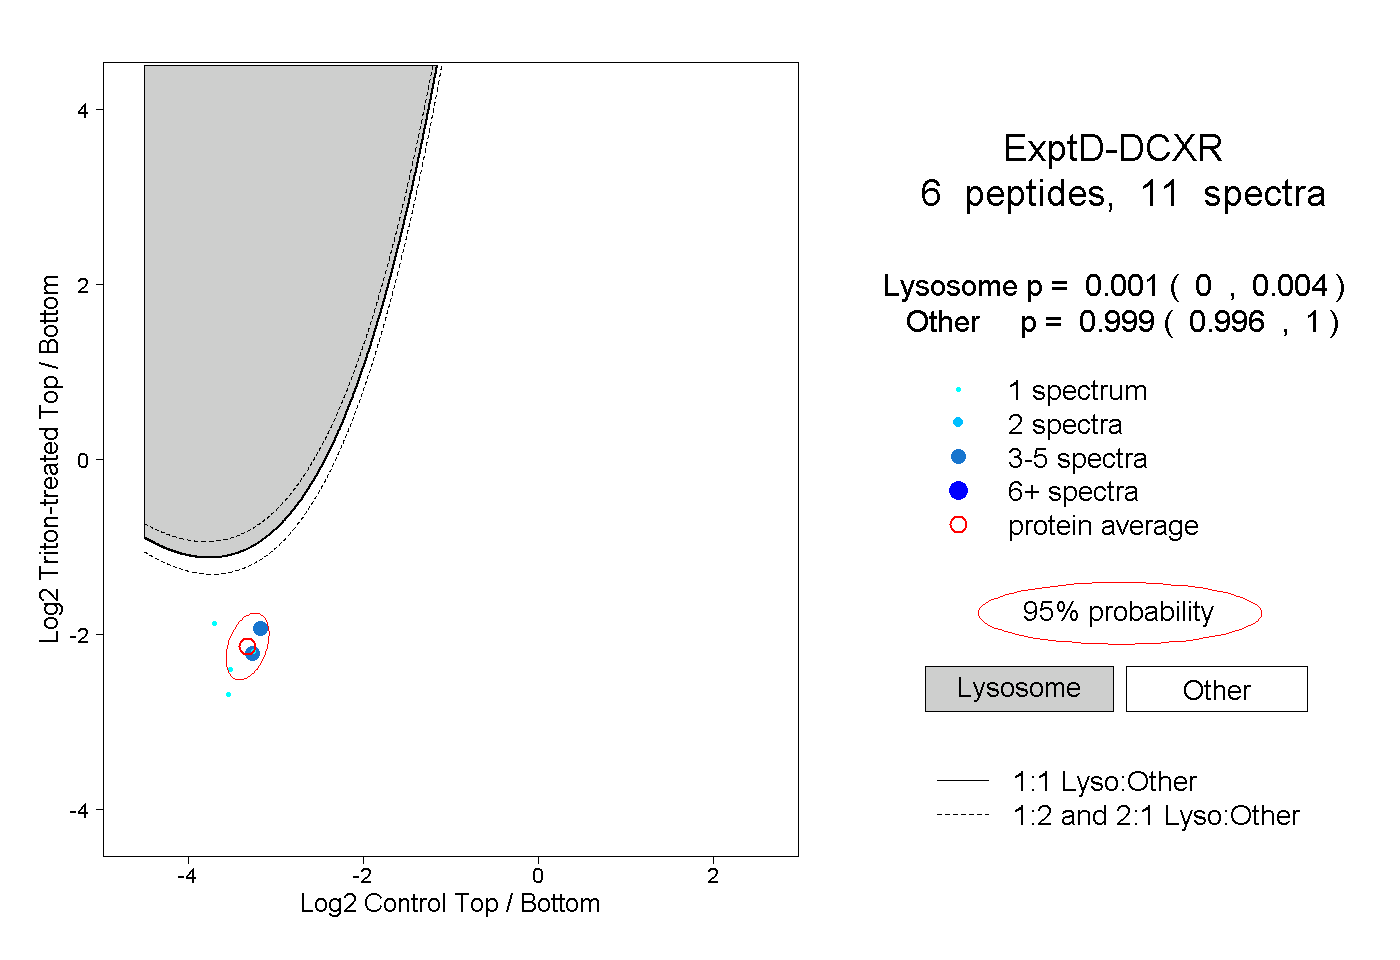 |
0.001 0.000 | 0.004 |
0.999 0.996 | 1.000 |