 1
1peptide
spectra
NA | NA
NA | NA
NA | NA
NA | NA
NA | NA
NA | NA
NA | NA
NA | NA
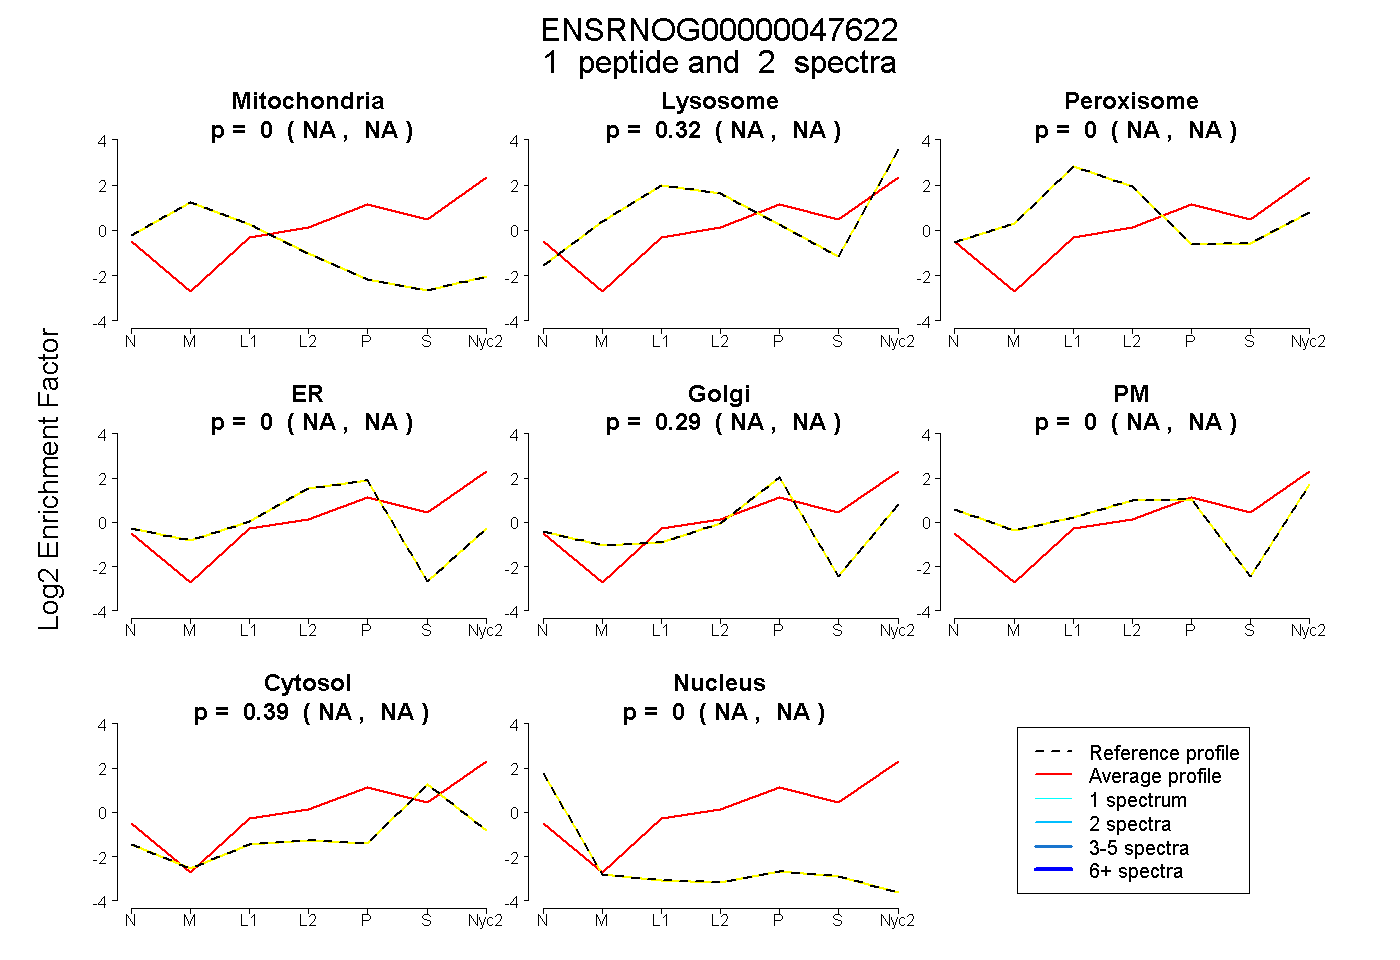
| Plot | Mito | Lyso | Perox | ER | Golgi | PM | Cytosol | Nucleus | |||||
| Expt A |
1 peptide |
2 spectra |
|
0.000 NA | NA |
0.320 NA | NA |
0.000 NA | NA |
0.000 NA | NA |
0.293 NA | NA |
0.000 NA | NA |
0.388 NA | NA |
0.000 NA | NA |
| 2 spectra, SQVFLK | 0.000 | 0.320 | 0.000 | 0.000 | 0.293 | 0.000 | 0.388 | 0.000 |
| Plot | Lyso | Other | |||||||||||
| Expt C |
1 peptide |
3 spectra |
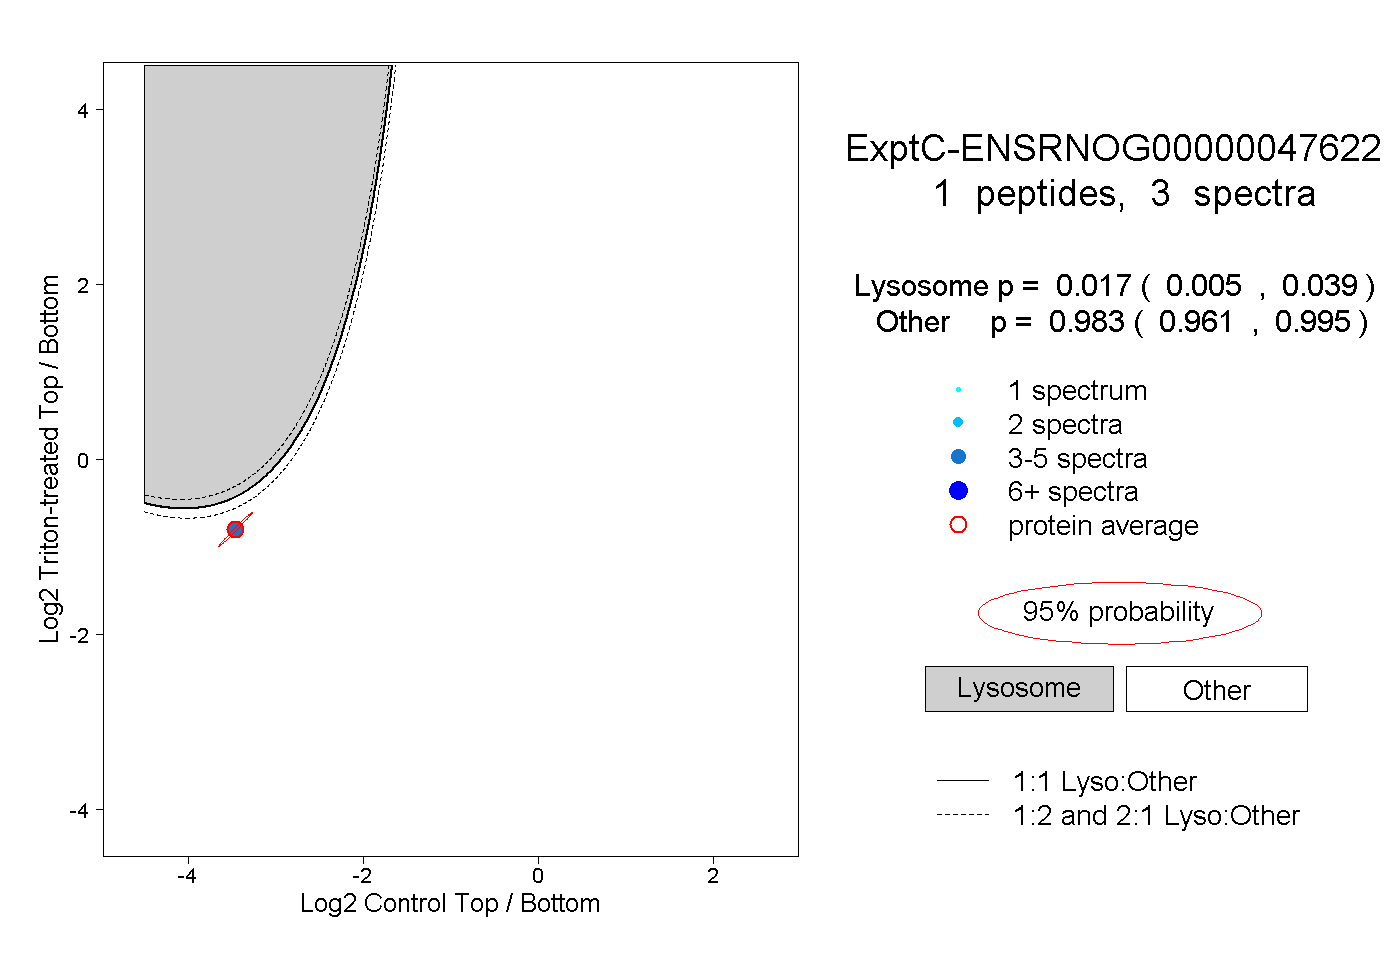 |
0.017 0.005 | 0.039 |
0.983 0.961 | 0.995 |