 1
1peptide
spectra
NA | NA
NA | NA
NA | NA
NA | NA
NA | NA
NA | NA
NA | NA
NA | NA
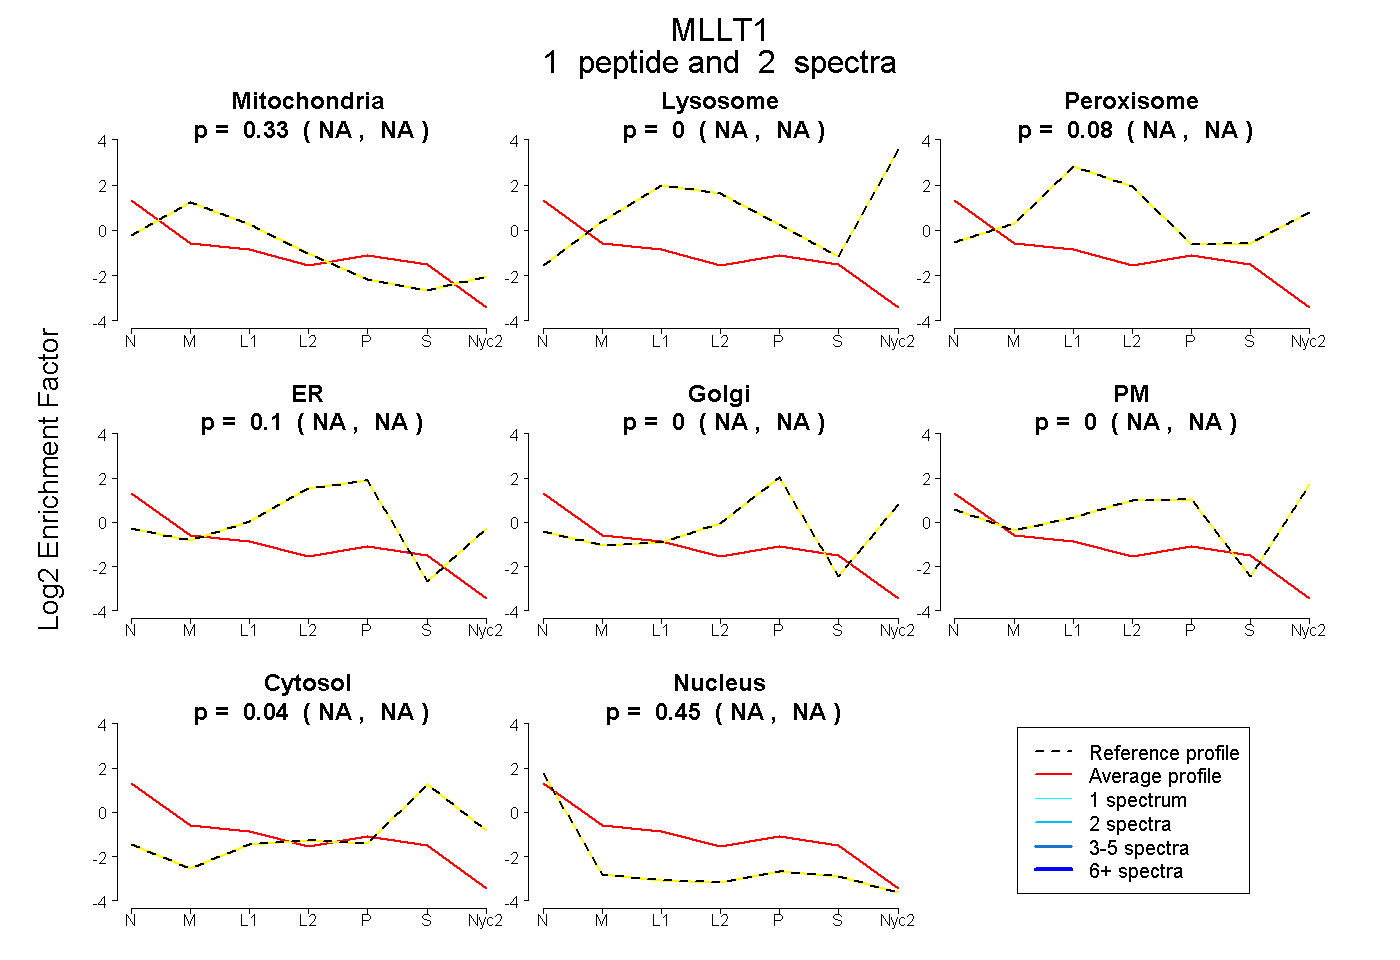
| Plot | Mito | Lyso | Perox | ER | Golgi | PM | Cytosol | Nucleus | |||||
| Expt A |
1 peptide |
2 spectra |
|
0.330 NA | NA |
0.000 NA | NA |
0.079 NA | NA |
0.097 NA | NA |
0.000 NA | NA |
0.000 NA | NA |
0.039 NA | NA |
0.455 NA | NA |
| 2 spectra, LELGHR | 0.330 | 0.000 | 0.079 | 0.097 | 0.000 | 0.000 | 0.039 | 0.455 |