 4
4peptides
spectra
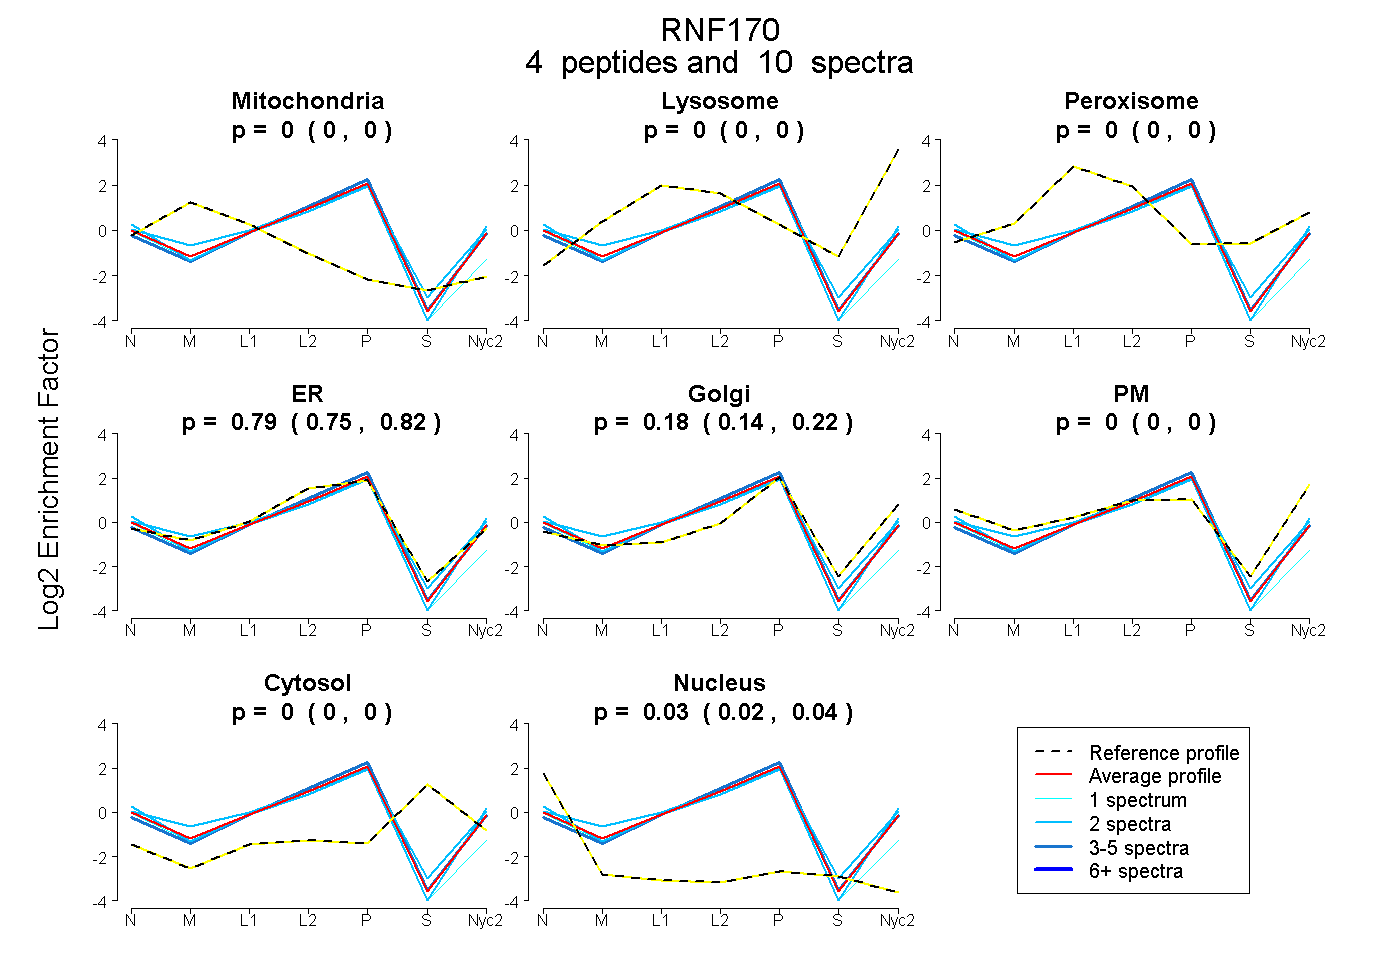
0.000 | 0.000
0.000 | 0.000
0.000 | 0.000
0.752 | 0.816
0.137 | 0.217
0.000 | 0.000
0.000 | 0.000
0.022 | 0.042
1peptide
spectrum
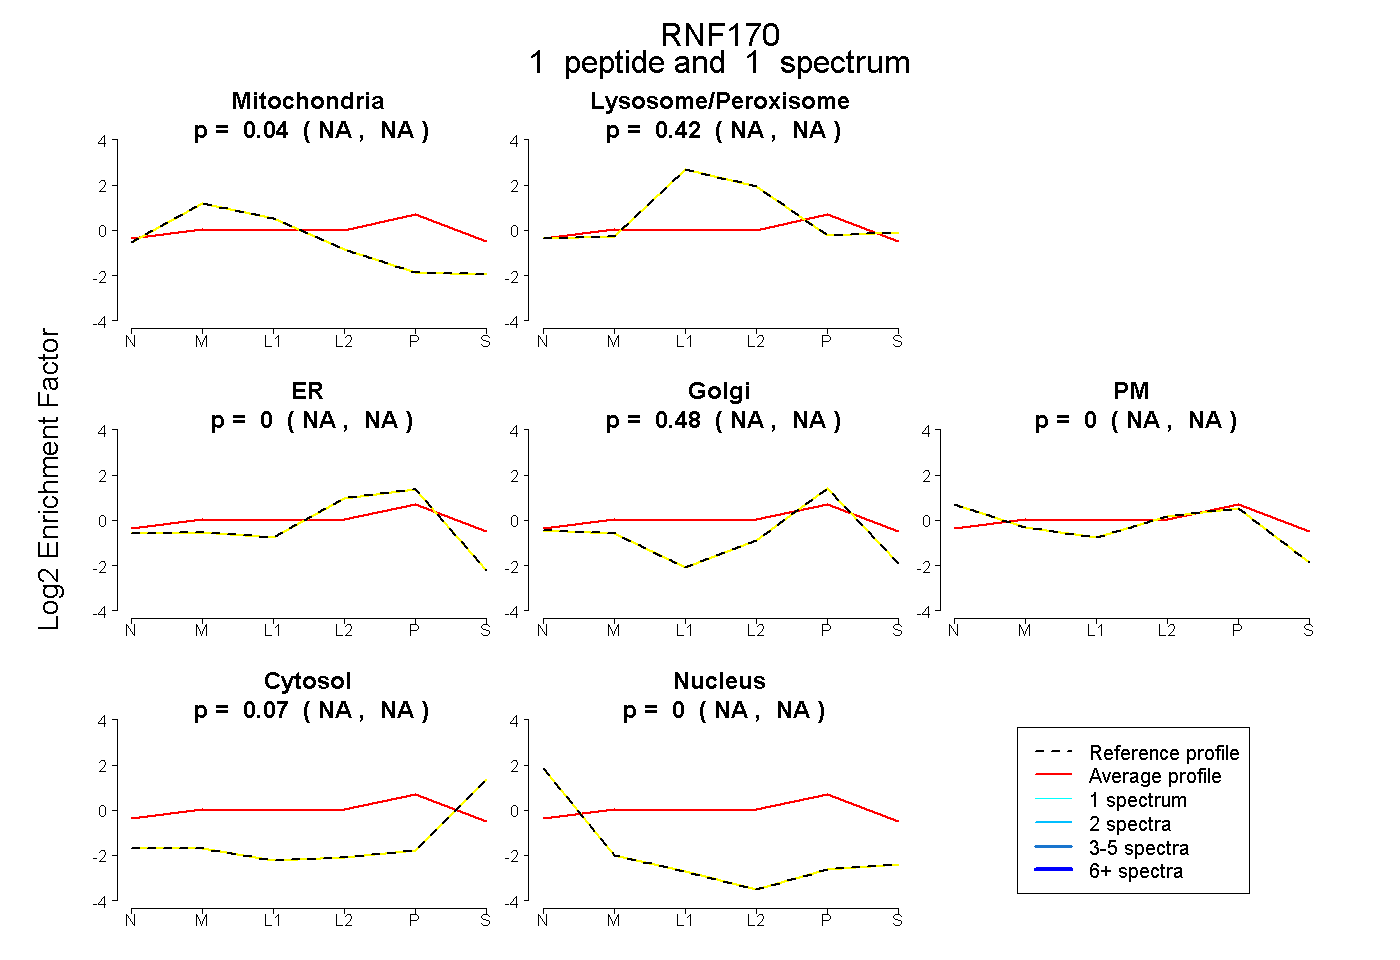
NA | NA
NA | NA
NA | NA
NA | NA
NA | NA
NA | NA
NA | NA
5peptides
spectra
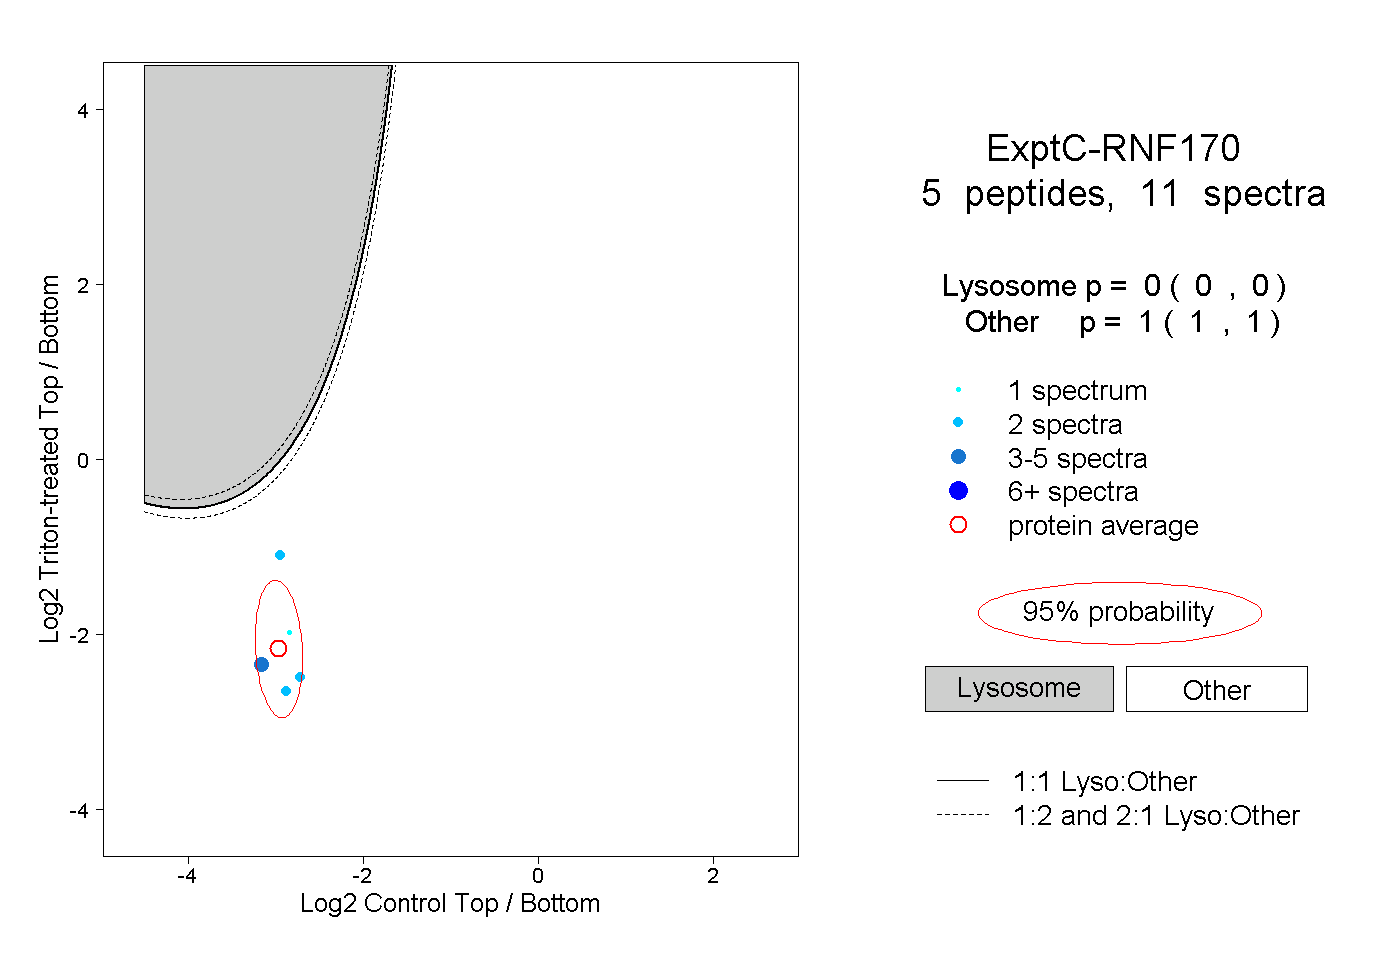
0.000 | 0.000
1.000 | 1.000