10
10peptides
spectra
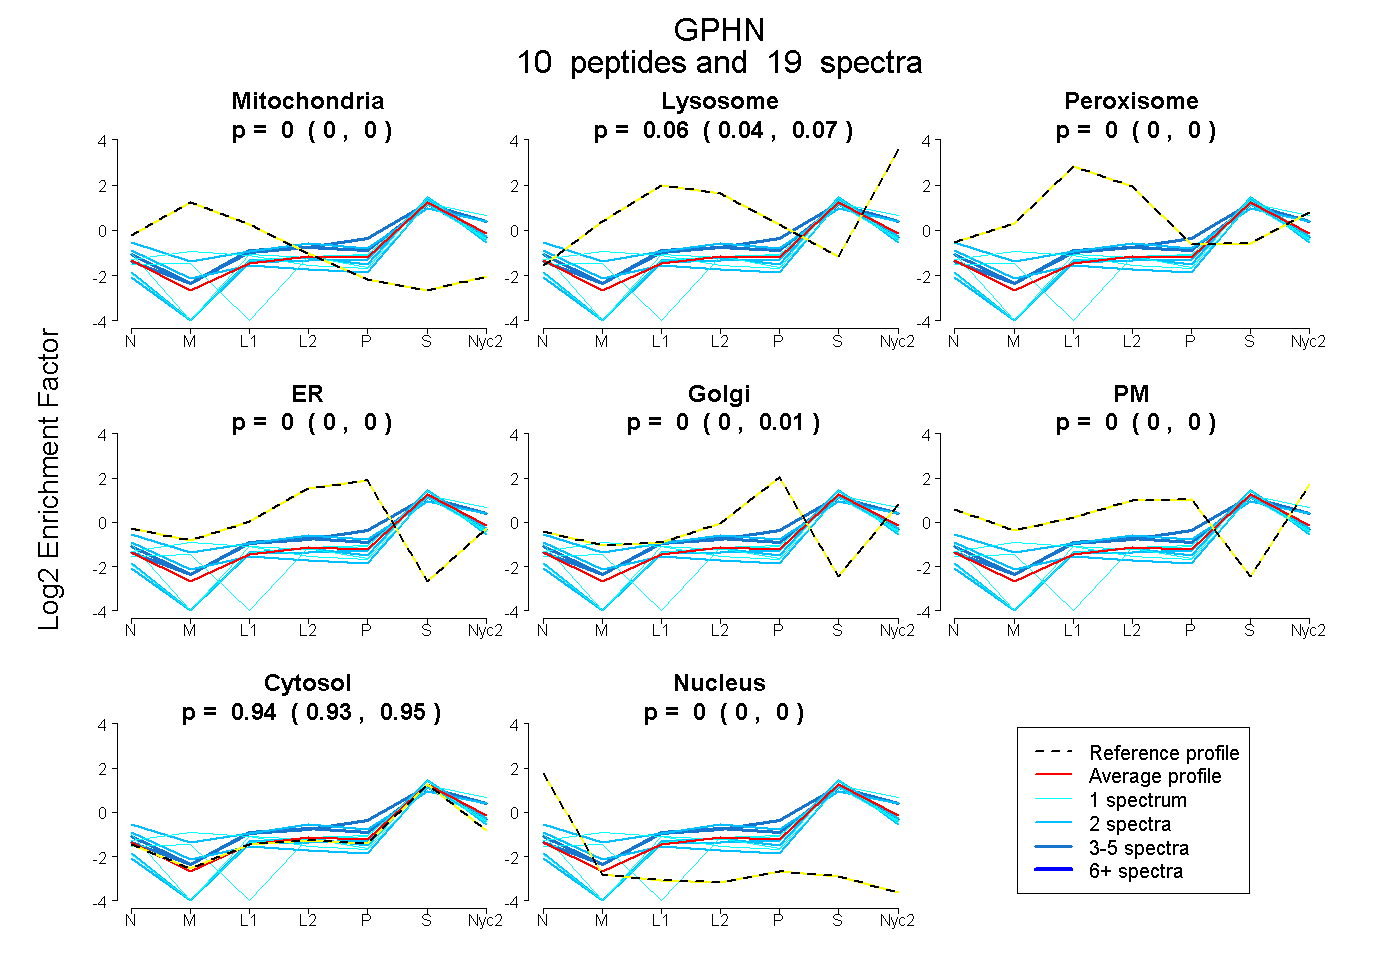
0.000 | 0.000
0.041 | 0.071
0.000 | 0.000
0.000 | 0.000
0.000 | 0.014
0.000 | 0.000
0.926 | 0.948
0.000 | 0.000
5peptides
spectra
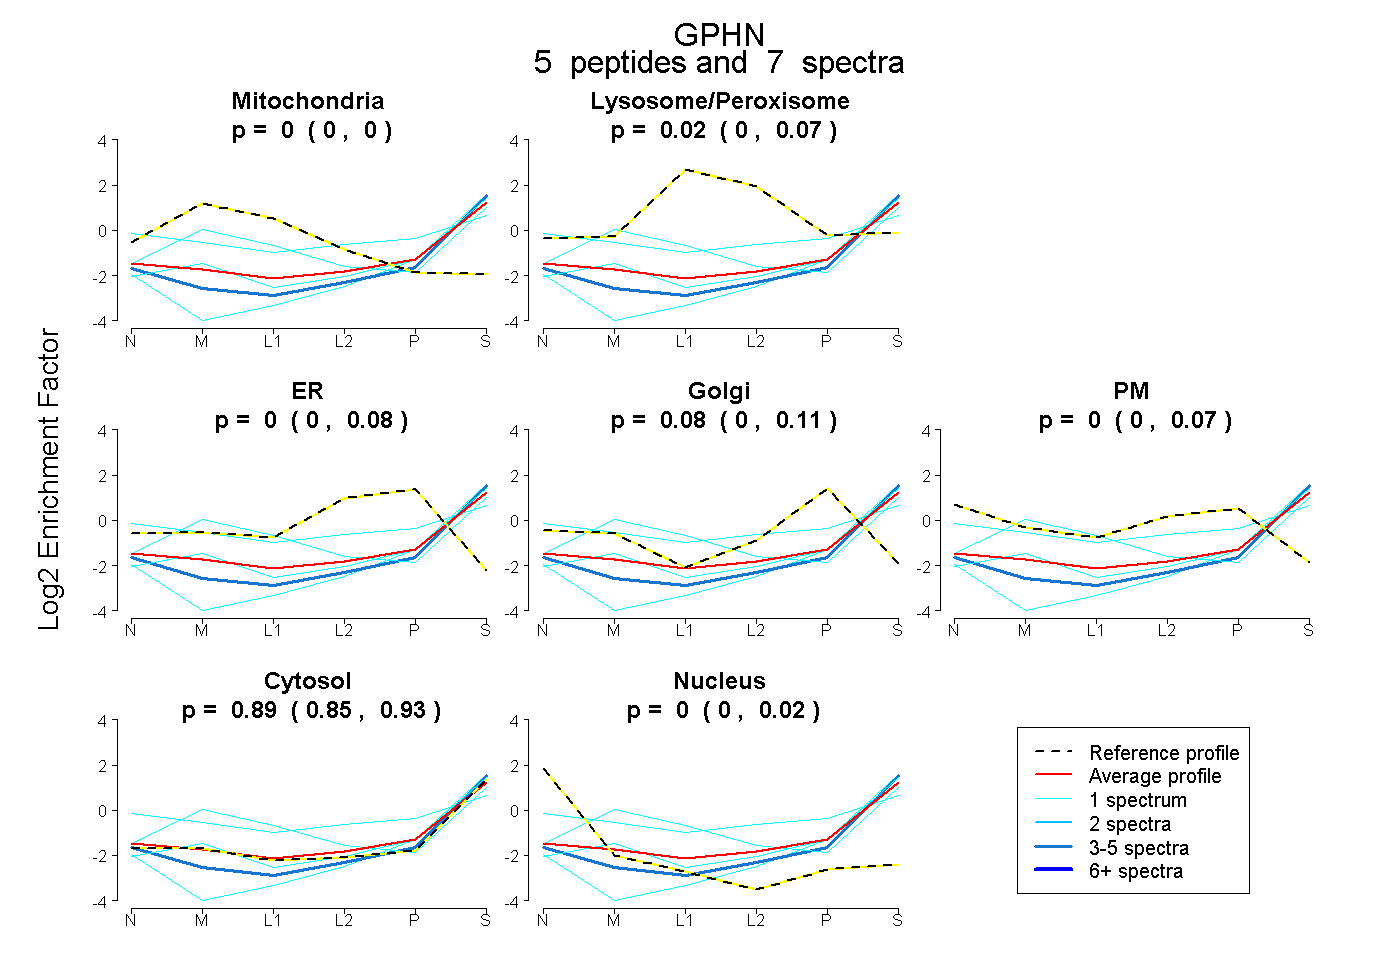
0.000 | 0.000
0.000 | 0.066
0.000 | 0.081
0.000 | 0.112
0.000 | 0.067
0.852 | 0.931
0.000 | 0.018
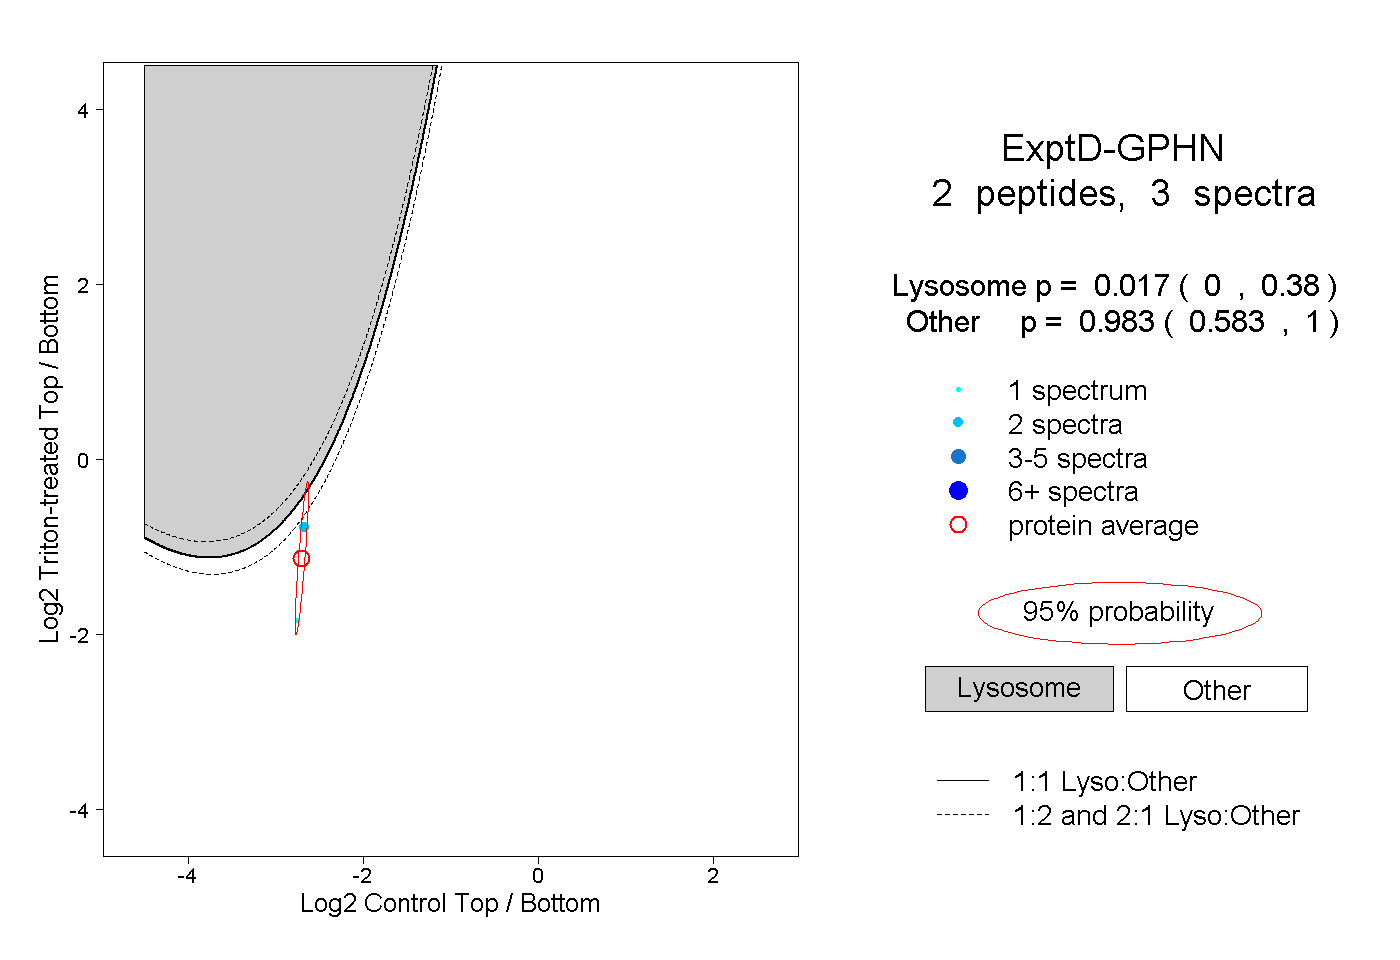
12peptides
spectra
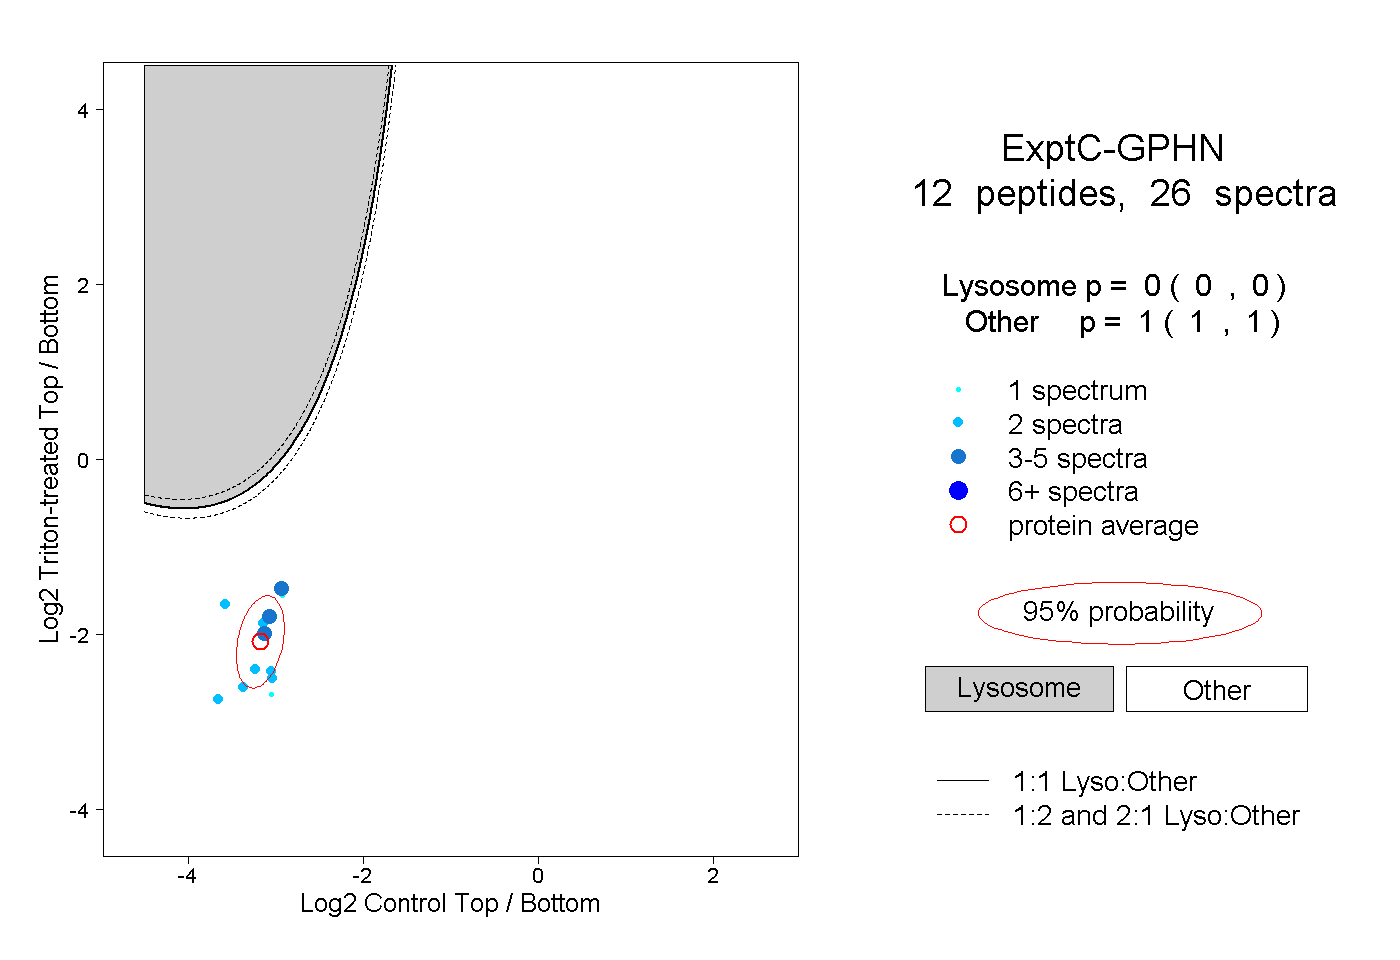
0.000 | 0.000
1.000 | 1.000