 10
10peptides
spectra
0.000 | 0.000
0.041 | 0.071
0.000 | 0.000
0.000 | 0.000
0.000 | 0.014
0.000 | 0.000
0.926 | 0.948
0.000 | 0.000
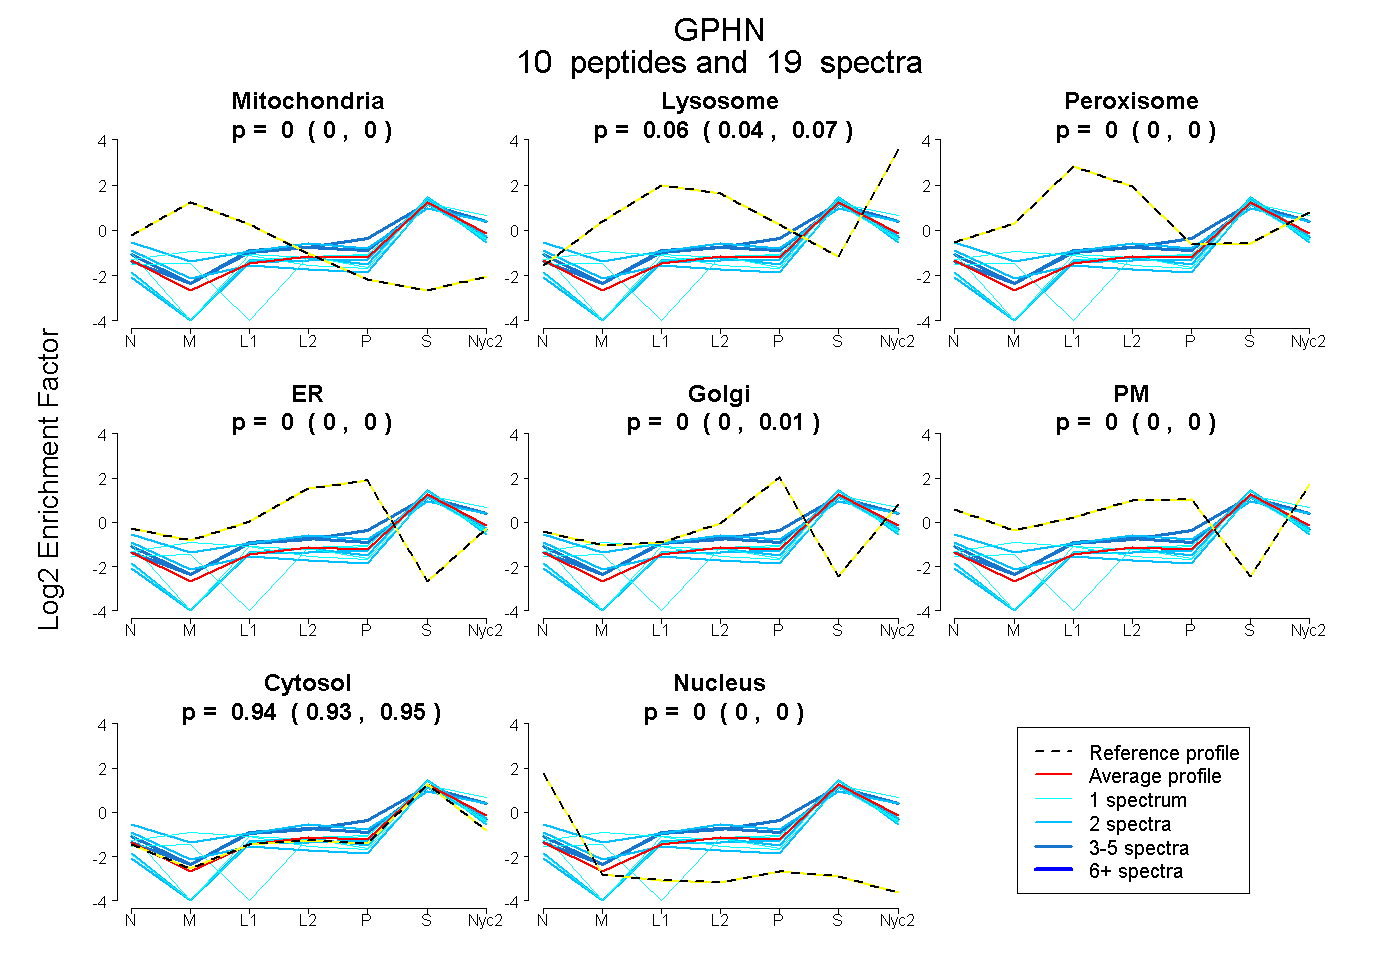
| Plot | Mito | Lyso | Perox | ER | Golgi | PM | Cytosol | Nucleus | |||||
| Expt A |
10 peptides |
19 spectra |
|
0.000 0.000 | 0.000 |
0.060 0.041 | 0.071 |
0.000 0.000 | 0.000 |
0.000 0.000 | 0.000 |
0.000 0.000 | 0.014 |
0.000 0.000 | 0.000 |
0.940 0.926 | 0.948 |
0.000 0.000 | 0.000 |
| 2 spectra, MQGILDPRPTIIK | 0.000 | 0.131 | 0.003 | 0.000 | 0.000 | 0.157 | 0.709 | 0.000 | ||
| 2 spectra, GEVVDVMVIGR | 0.010 | 0.022 | 0.000 | 0.000 | 0.000 | 0.000 | 0.915 | 0.053 | ||
| 1 spectrum, VLAQDVYAK | 0.160 | 0.063 | 0.000 | 0.000 | 0.000 | 0.000 | 0.778 | 0.000 | ||
| 4 spectra, DGYAVR | 0.000 | 0.082 | 0.000 | 0.034 | 0.065 | 0.000 | 0.819 | 0.000 | ||
| 2 spectra, GVQVLPR | 0.000 | 0.000 | 0.000 | 0.000 | 0.000 | 0.000 | 1.000 | 0.000 | ||
| 1 spectrum, LDPRPEYHR | 0.000 | 0.000 | 0.000 | 0.000 | 0.000 | 0.001 | 0.999 | 0.000 | ||
| 1 spectrum, LSTASCPTPK | 0.000 | 0.000 | 0.000 | 0.000 | 0.000 | 0.000 | 1.000 | 0.000 | ||
| 1 spectrum, VFMKPGLPTTFATLDIDGVR | 0.000 | 0.000 | 0.000 | 0.000 | 0.123 | 0.000 | 0.877 | 0.000 | ||
| 3 spectra, ADVIITSGGVSMGEK | 0.000 | 0.175 | 0.000 | 0.000 | 0.000 | 0.012 | 0.813 | 0.000 | ||
| 2 spectra, IPDSIISR | 0.000 | 0.000 | 0.000 | 0.000 | 0.000 | 0.000 | 1.000 | 0.000 |
| Plot | Mito | Lyso or Perox | ER | Golgi | PM | Cytosol | Nucleus | ||||||
| Expt B |
5 peptides |
7 spectra |
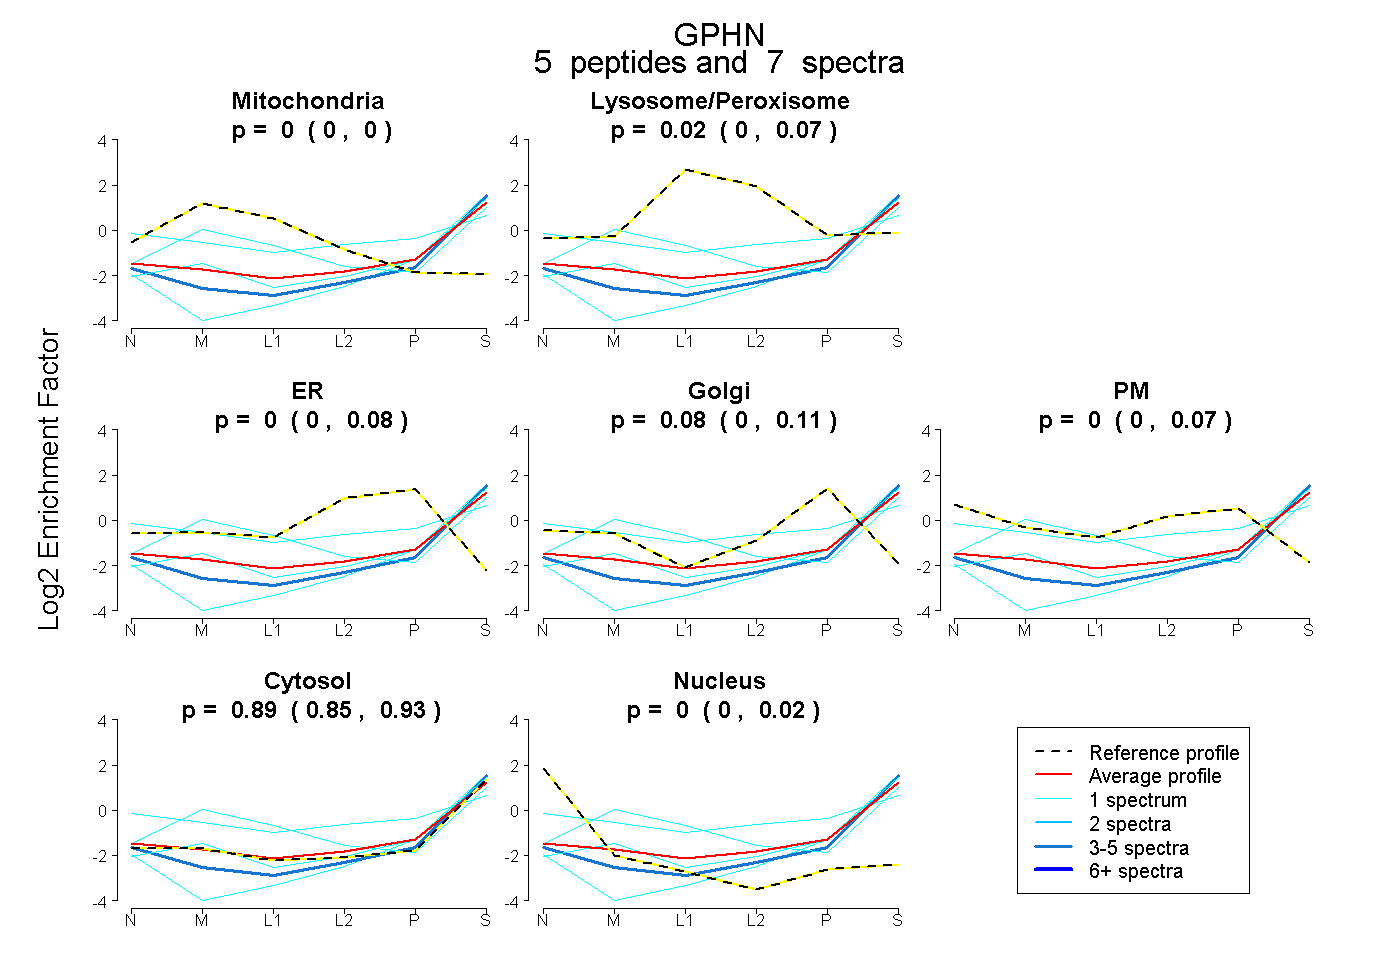 |
0.000 0.000 | 0.000 |
0.023 0.000 | 0.066 |
0.000 0.000 | 0.081 |
0.084 0.000 | 0.112 |
0.000 0.000 | 0.067 |
0.893 0.852 | 0.931 |
0.000 0.000 | 0.018 |
|||
| Plot | Lyso | Other | |||||||||||
| Expt C |
12 peptides |
26 spectra |
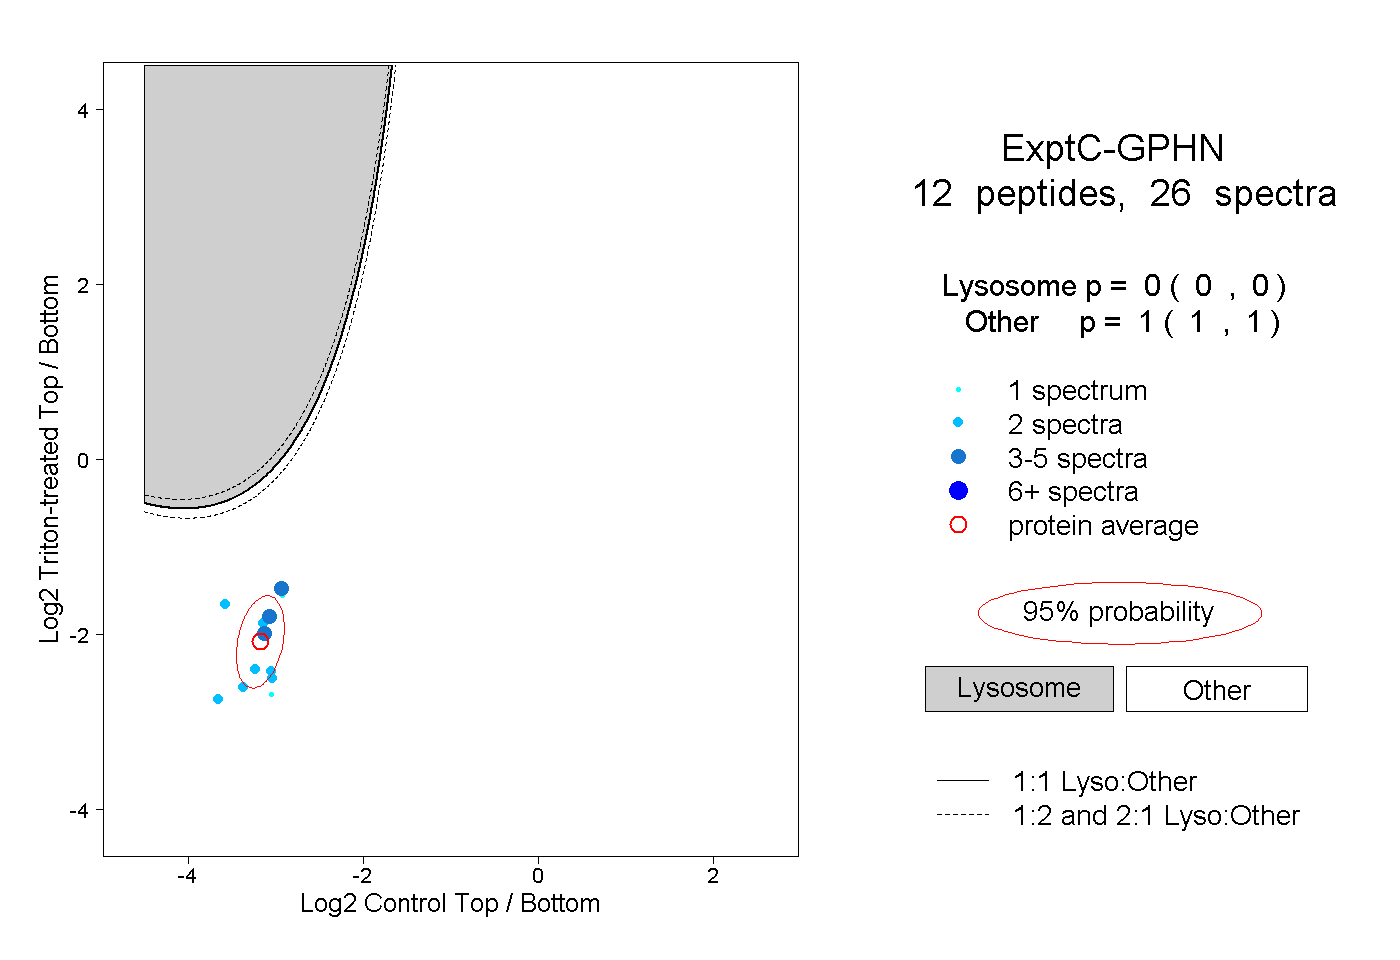 |
0.000 0.000 | 0.000 |
1.000 1.000 | 1.000 |
||||||||
| Plot | Lyso | Other | |||||||||||
| Expt D |
2 peptides |
3 spectra |
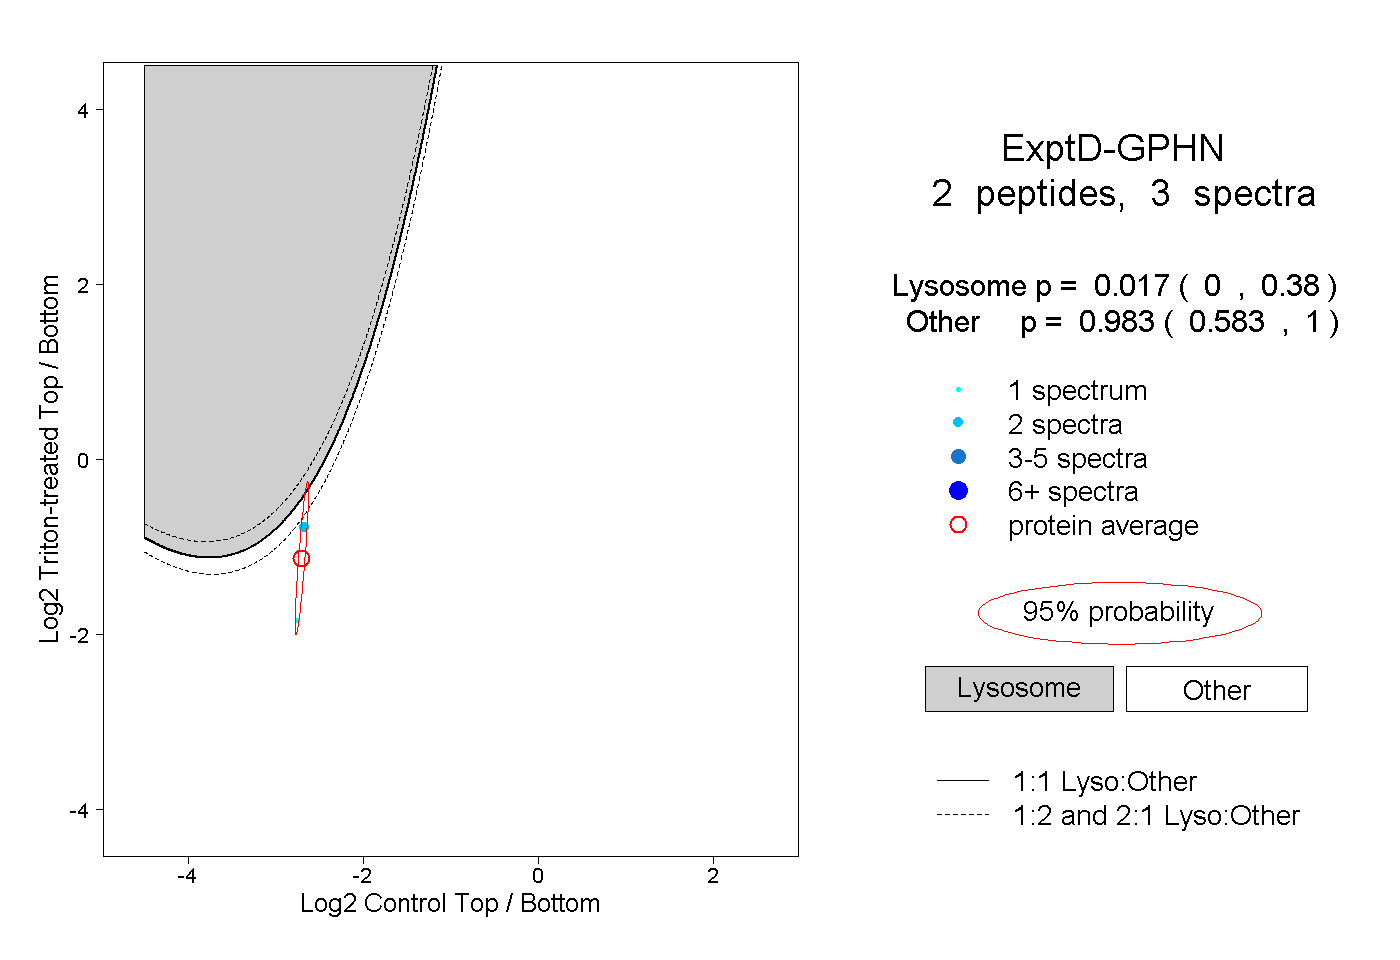 |
0.017 0.000 | 0.380 |
0.983 0.583 | 1.000 |