 5
5peptides
spectra
0.000 | 0.004
0.000 | 0.000
0.000 | 0.026
0.518 | 0.675
0.000 | 0.105
0.266 | 0.388
0.000 | 0.008
0.000 | 0.020
1peptide
spectrum
NA | NA
NA | NA
NA | NA
NA | NA
NA | NA
NA | NA
NA | NA
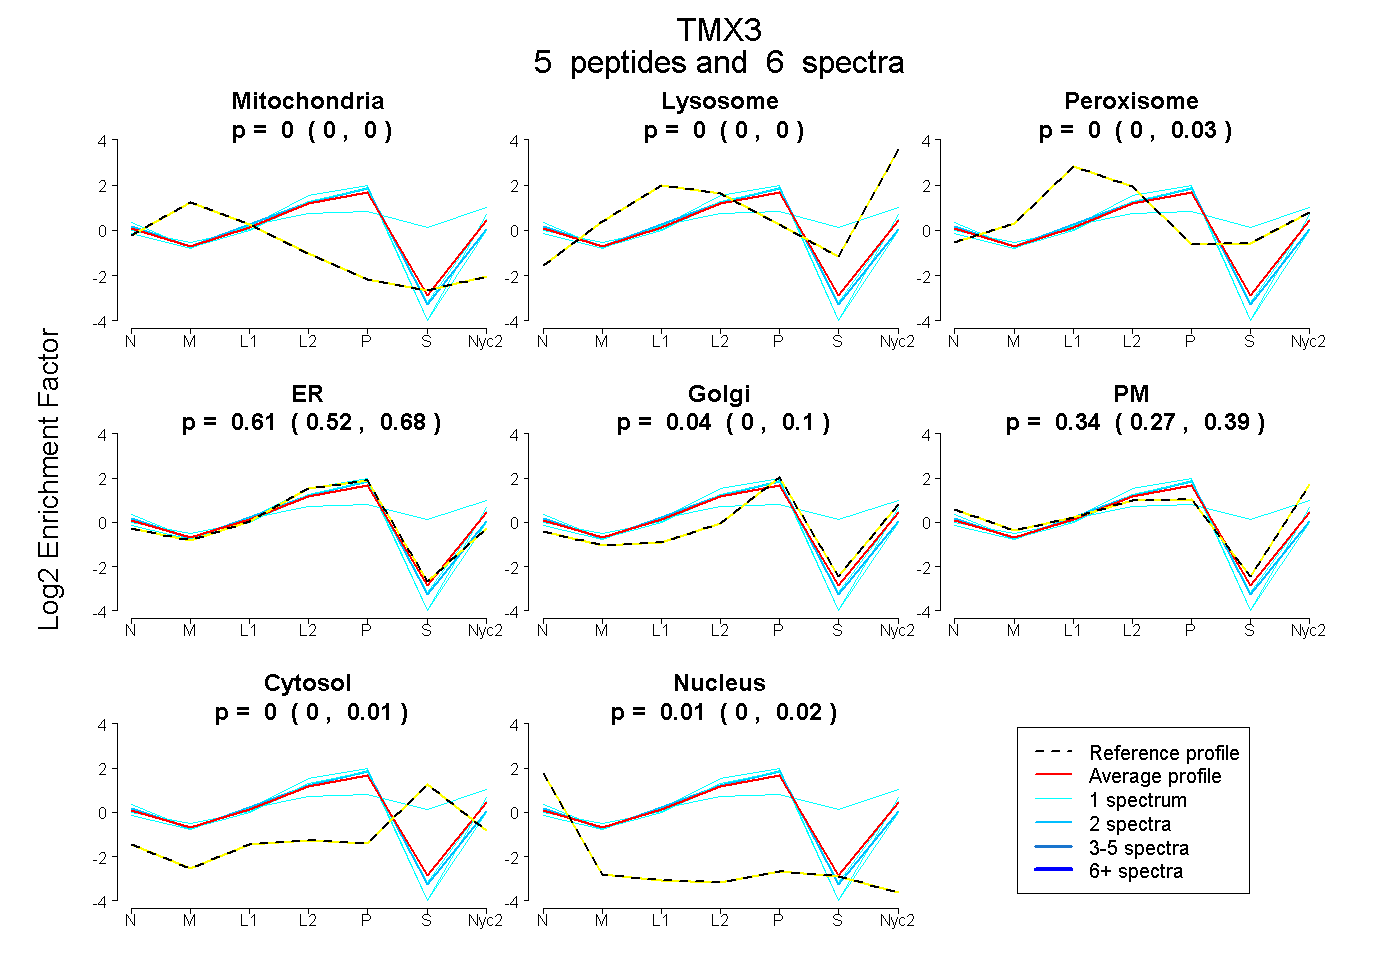
| Plot | Mito | Lyso | Perox | ER | Golgi | PM | Cytosol | Nucleus | |||||
| Expt A |
5 peptides |
6 spectra |
|
0.000 0.000 | 0.004 |
0.000 0.000 | 0.000 |
0.000 0.000 | 0.026 |
0.611 0.518 | 0.675 |
0.040 0.000 | 0.105 |
0.343 0.266 | 0.388 |
0.000 0.000 | 0.008 |
0.006 0.000 | 0.020 |
||
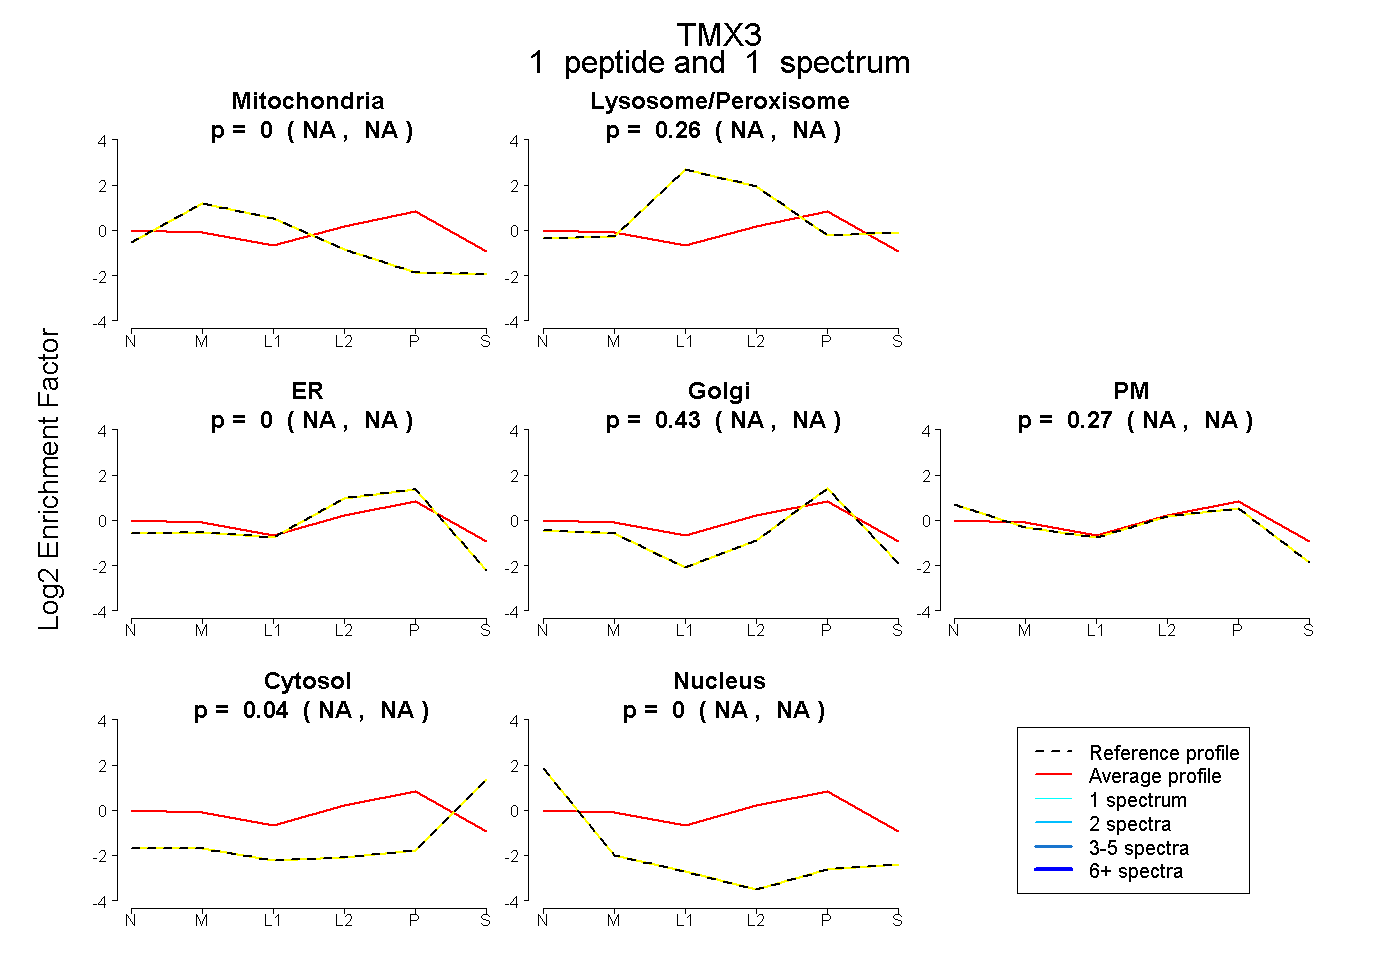
| Plot | Mito | Lyso or Perox | ER | Golgi | PM | Cytosol | Nucleus | ||||||
| Expt B |
1 peptide |
1 spectrum |
|
0.000 NA | NA |
0.261 NA | NA |
0.000 NA | NA |
0.434 NA | NA |
0.268 NA | NA |
0.037 NA | NA |
0.000 NA | NA |
| 1 spectrum, STIVSIFK | 0.000 | 0.261 | 0.000 | 0.434 | 0.268 | 0.037 | 0.000 |
| Plot | Lyso | Other | |||||||||||
| Expt C |
5 peptides |
14 spectra |
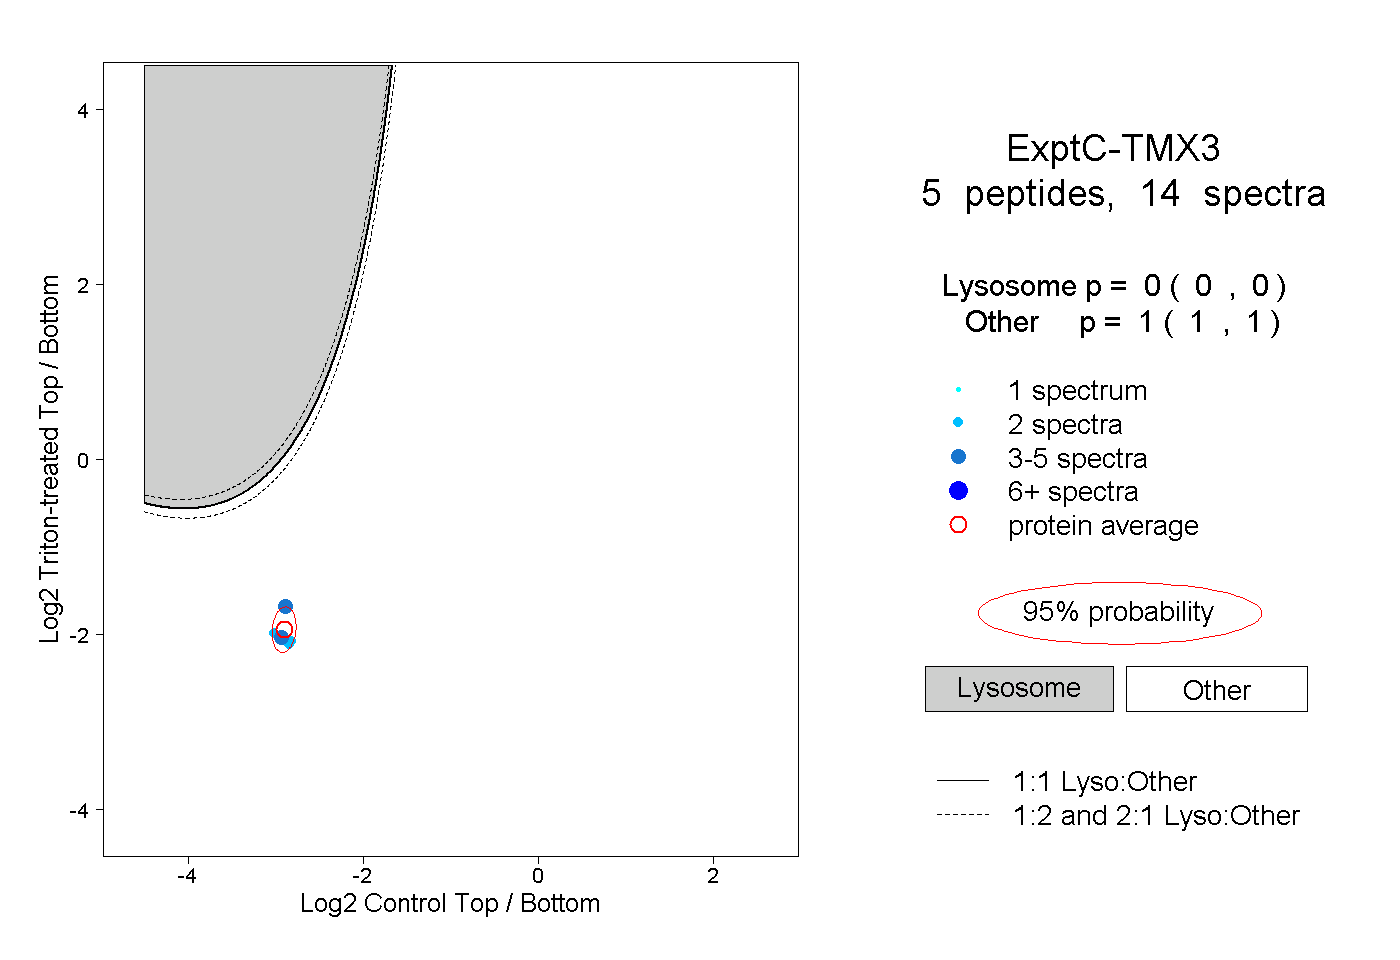 |
0.000 0.000 | 0.000 |
1.000 1.000 | 1.000 |
||||||||
| Plot | Lyso | Other | |||||||||||
| Expt D |
2 peptides |
3 spectra |
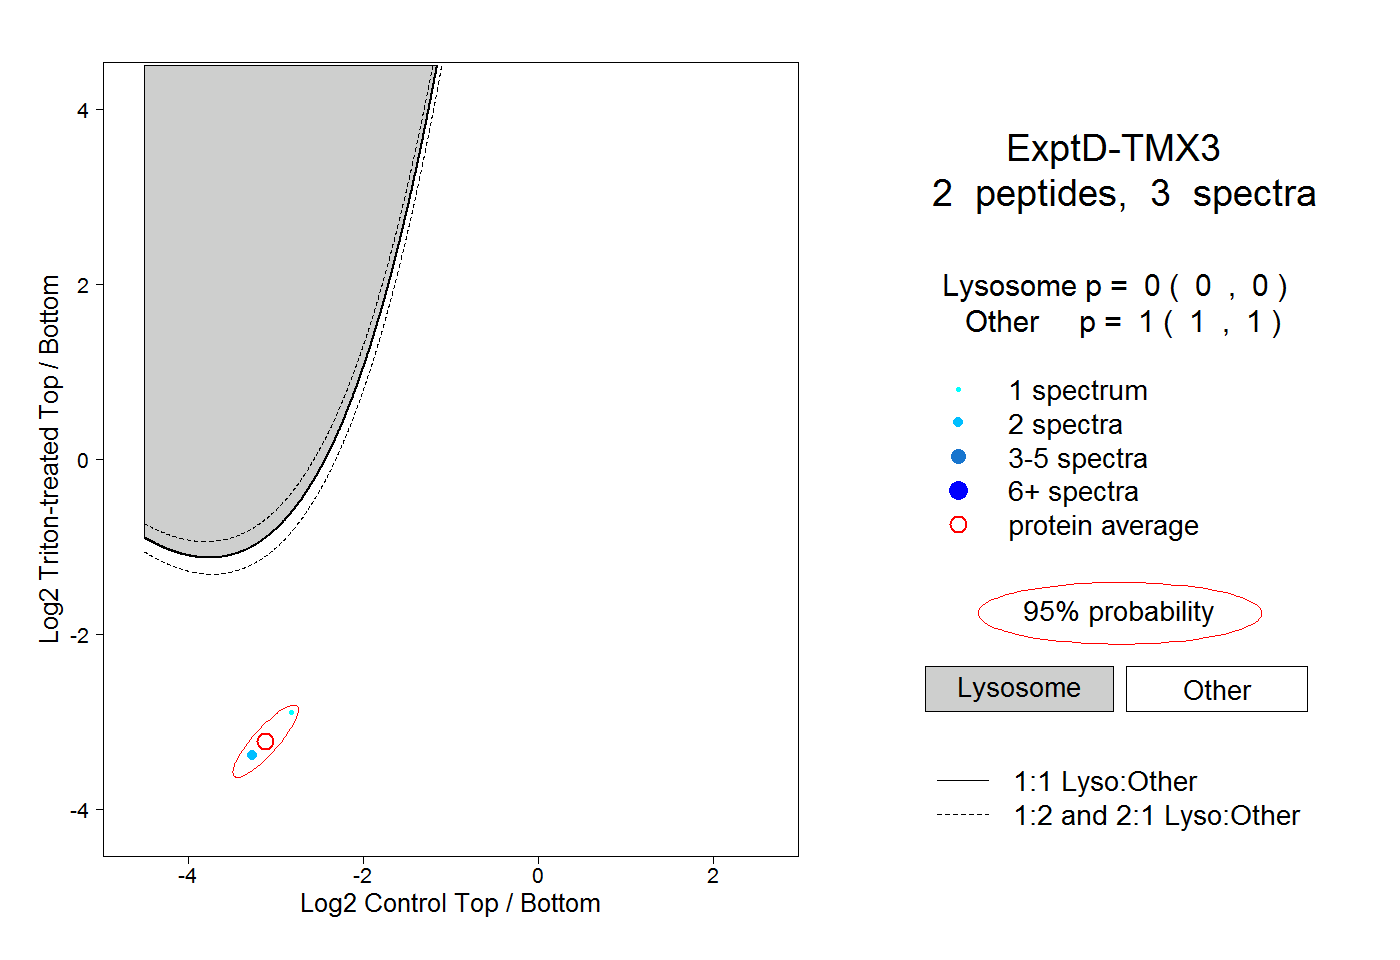 |
0.000 0.000 | 0.000 |
1.000 1.000 | 1.000 |