 11
11peptides
spectra
0.000 | 0.000
0.000 | 0.000
0.000 | 0.000
0.000 | 0.177
0.090 | 0.284
0.000 | 0.000
0.112 | 0.165
0.538 | 0.586
| Plot | Mito | Lyso | Perox | ER | Golgi | PM | Cytosol | Nucleus | |||||
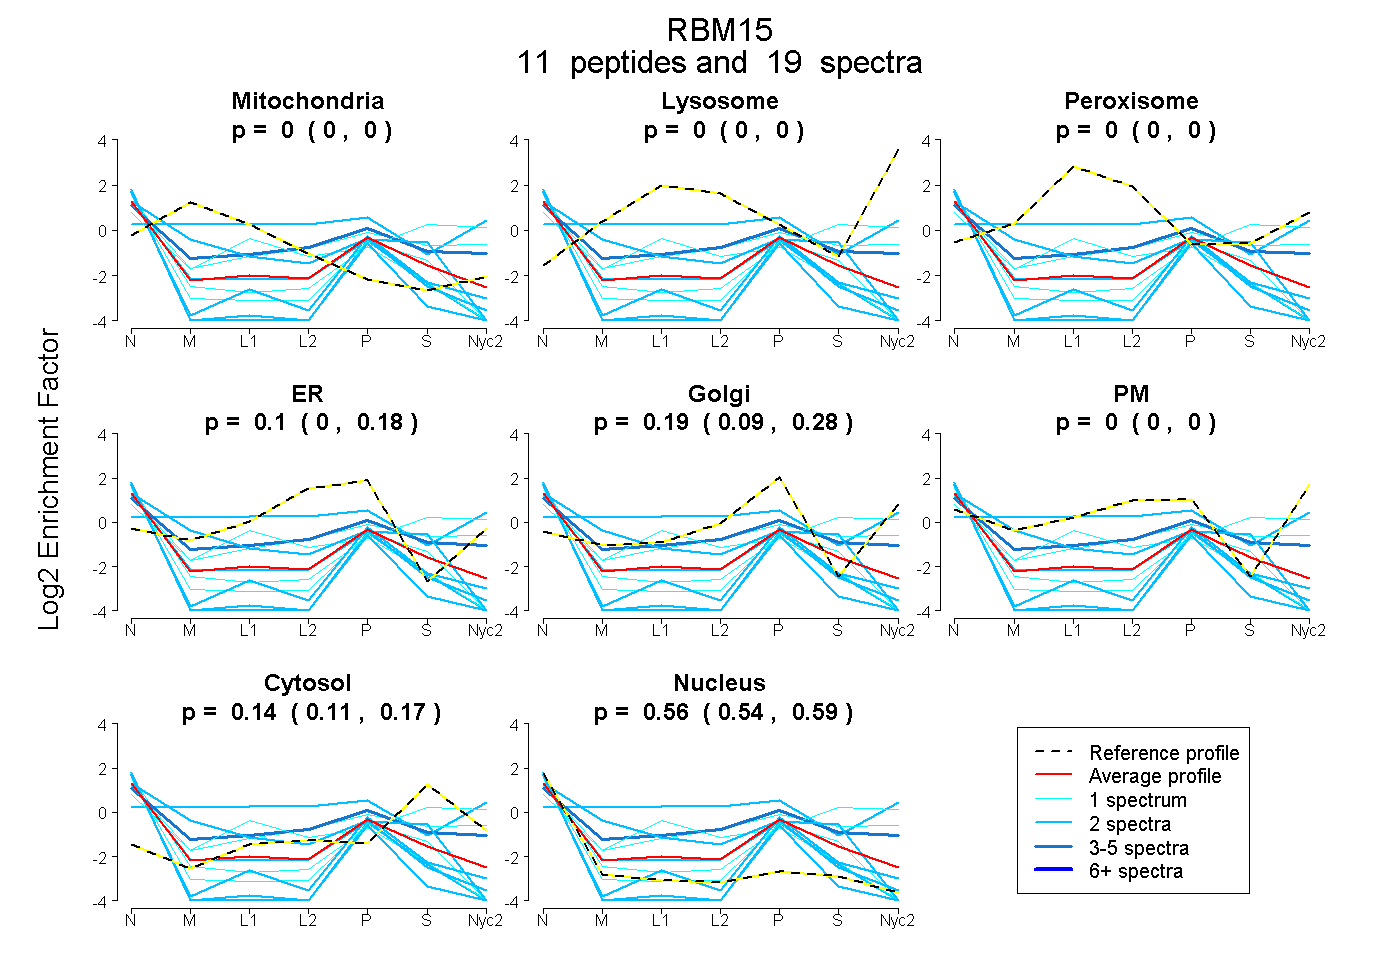
| Expt A |
11 peptides |
19 spectra |
|
0.000 0.000 | 0.000 |
0.000 0.000 | 0.000 |
0.000 0.000 | 0.000 |
0.100 0.000 | 0.177 |
0.194 0.090 | 0.284 |
0.000 0.000 | 0.000 |
0.142 0.112 | 0.165 |
0.564 0.538 | 0.586 |
| 2 spectra, VAFVNFR | 0.307 | 0.000 | 0.000 | 0.253 | 0.000 | 0.000 | 0.000 | 0.440 | ||
| 3 spectra, NLVSYLK | 0.000 | 0.000 | 0.020 | 0.152 | 0.000 | 0.308 | 0.247 | 0.273 | ||
| 1 spectrum, DYPFYDR | 0.000 | 0.000 | 0.000 | 0.000 | 0.053 | 0.000 | 0.161 | 0.786 | ||
| 2 spectra, VDFADTEHR | 0.000 | 0.000 | 0.000 | 0.132 | 0.000 | 0.000 | 0.278 | 0.590 | ||
| 2 spectra, AATSAVTAYEPLDSLDR | 0.000 | 0.000 | 0.000 | 0.000 | 0.044 | 0.000 | 0.000 | 0.956 | ||
| 1 spectrum, LVLYDRPLK | 0.000 | 0.000 | 0.000 | 0.174 | 0.000 | 0.000 | 0.000 | 0.826 | ||
| 2 spectra, SSSSSATSDTAASTQRPLR | 0.000 | 0.000 | 0.000 | 0.000 | 0.017 | 0.000 | 0.000 | 0.983 | ||
| 2 spectra, VGAGAGAAPFR | 0.000 | 0.000 | 0.000 | 0.000 | 0.196 | 0.000 | 0.005 | 0.799 | ||
| 1 spectrum, LQQLLQR | 0.000 | 0.000 | 0.000 | 0.000 | 0.000 | 0.430 | 0.322 | 0.247 | ||
| 2 spectra, GQTSTYGFLK | 0.143 | 0.000 | 0.209 | 0.000 | 0.182 | 0.355 | 0.112 | 0.000 | ||
| 1 spectrum, SSGAASSAPGGGDGVEYK | 0.000 | 0.000 | 0.107 | 0.000 | 0.000 | 0.277 | 0.491 | 0.125 |
| Plot | Mito | Lyso or Perox | ER | Golgi | PM | Cytosol | Nucleus | ||||||
| Expt B |
1 peptide |
1 spectrum |
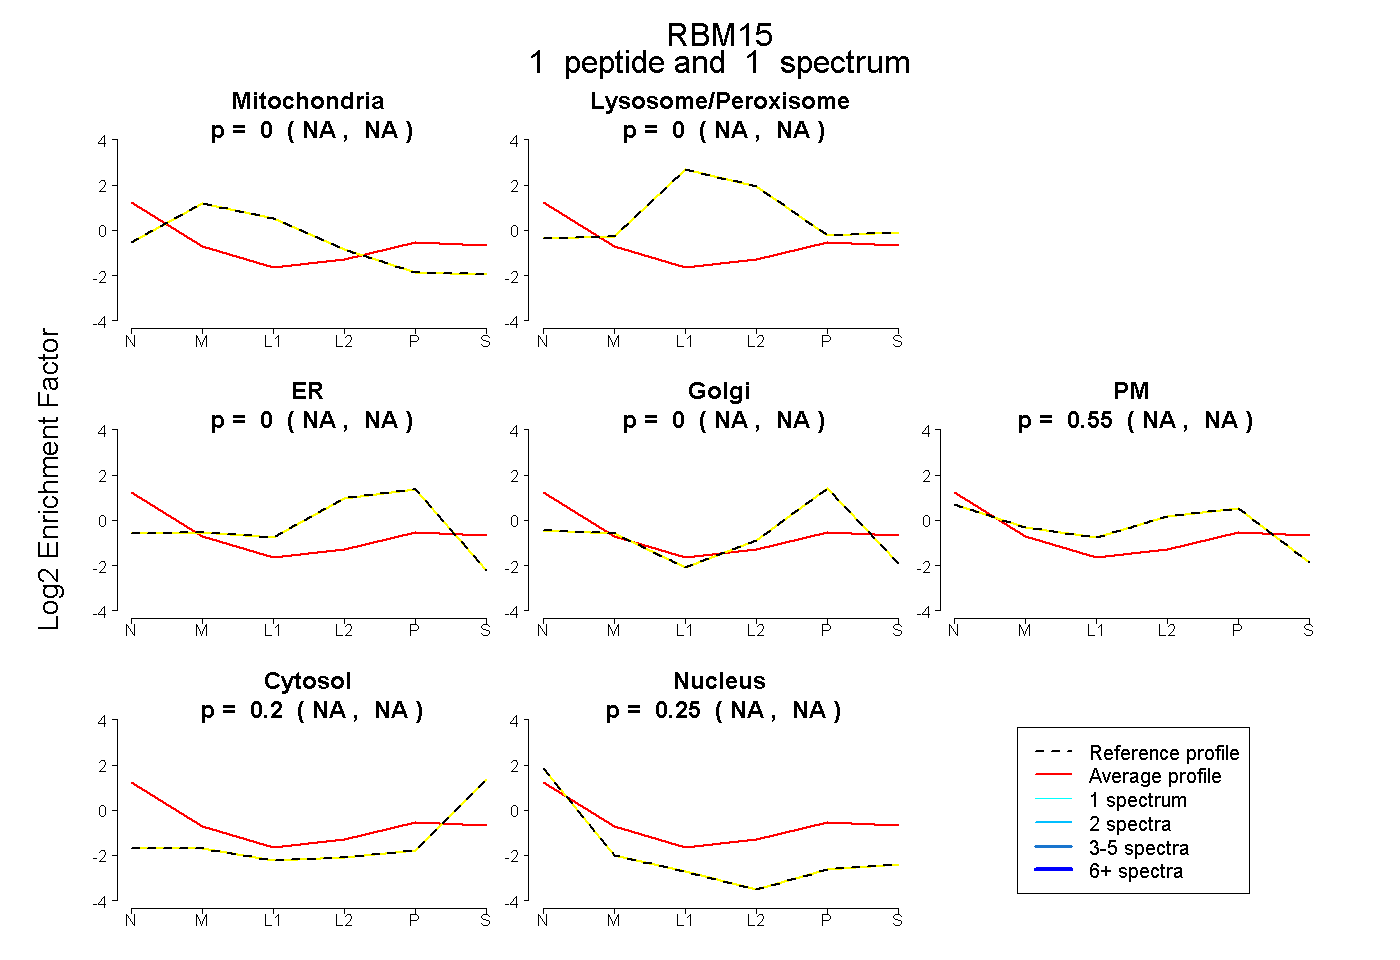 |
0.000 NA | NA |
0.000 NA | NA |
0.000 NA | NA |
0.000 NA | NA |
0.549 NA | NA |
0.199 NA | NA |
0.252 NA | NA |
|||
| Plot | Lyso | Other | |||||||||||
| Expt C |
2 peptides |
4 spectra |
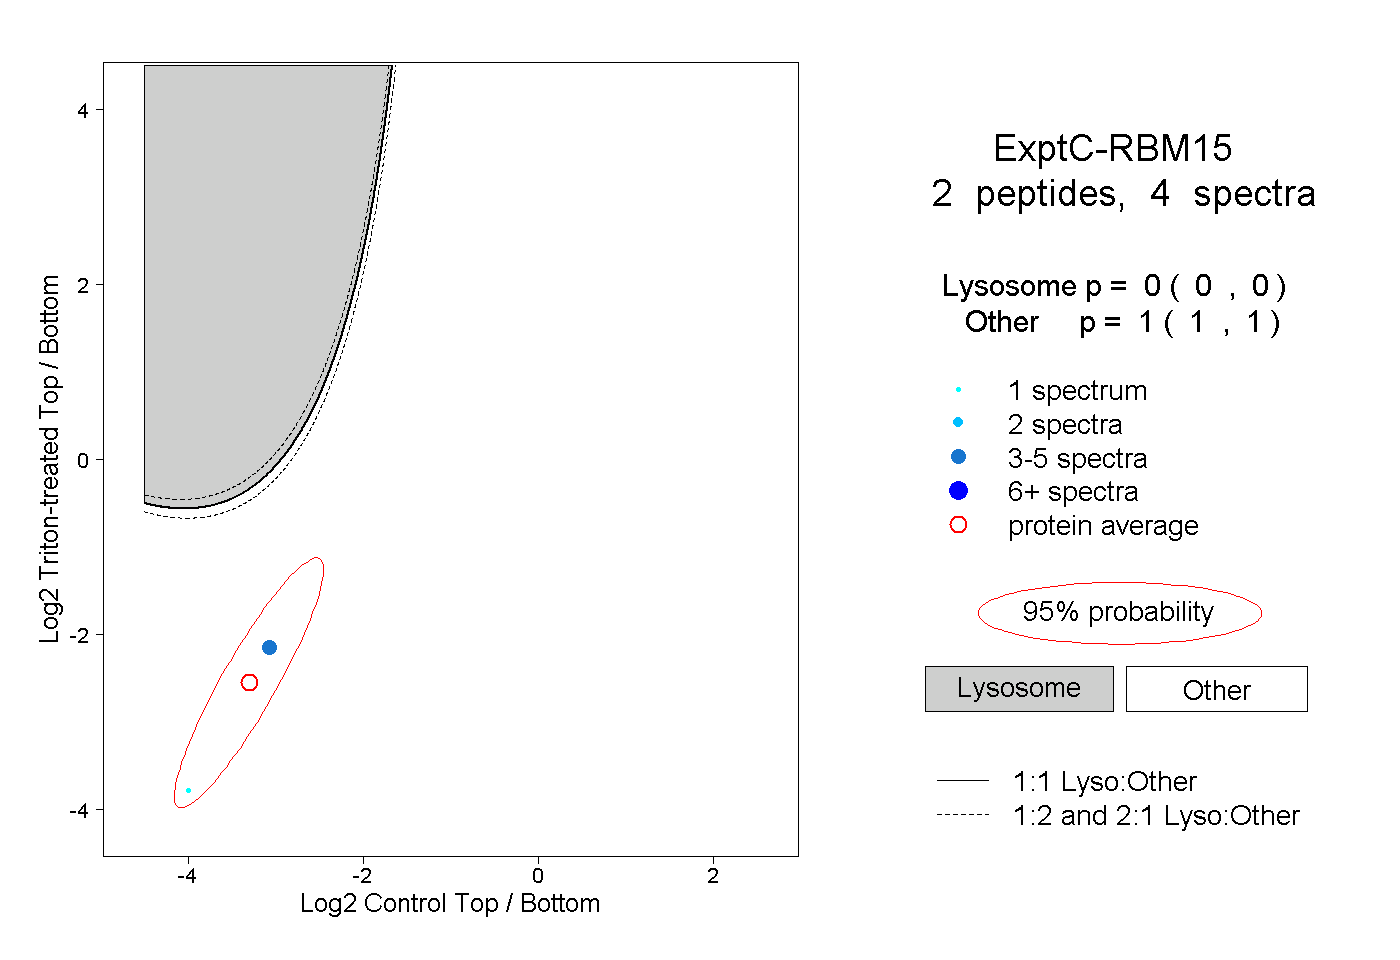 |
0.000 0.000 | 0.000 |
1.000 1.000 | 1.000 |