 2
2peptides
spectra
NA | NA
NA | NA
NA | NA
NA | NA
NA | NA
NA | NA
NA | NA
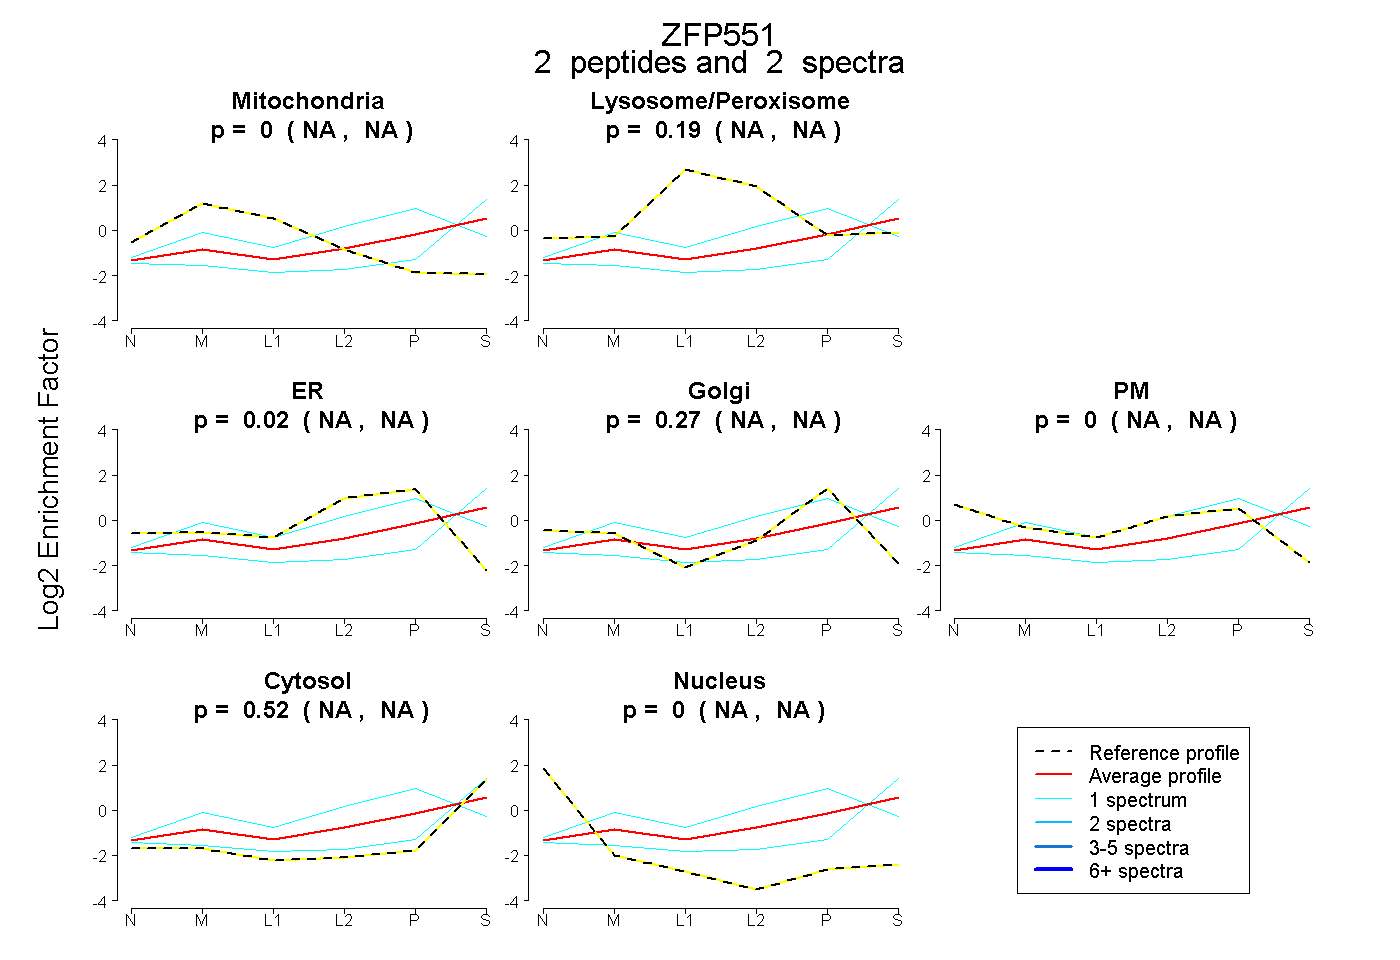
| Plot | Mito | Lyso or Perox | ER | Golgi | PM | Cytosol | Nucleus | ||||||
| Expt B |
2 peptides |
2 spectra |
|
0.000 NA | NA |
0.195 NA | NA |
0.021 NA | NA |
0.267 NA | NA |
0.000 NA | NA |
0.517 NA | NA |
0.000 NA | NA |
| 1 spectrum, EIFDLIR | 0.000 | 0.078 | 0.000 | 0.039 | 0.000 | 0.883 | 0.000 | |||
| 1 spectrum, TYEHTQNEK | 0.000 | 0.254 | 0.212 | 0.345 | 0.000 | 0.189 | 0.000 |