 4
4peptides
spectra
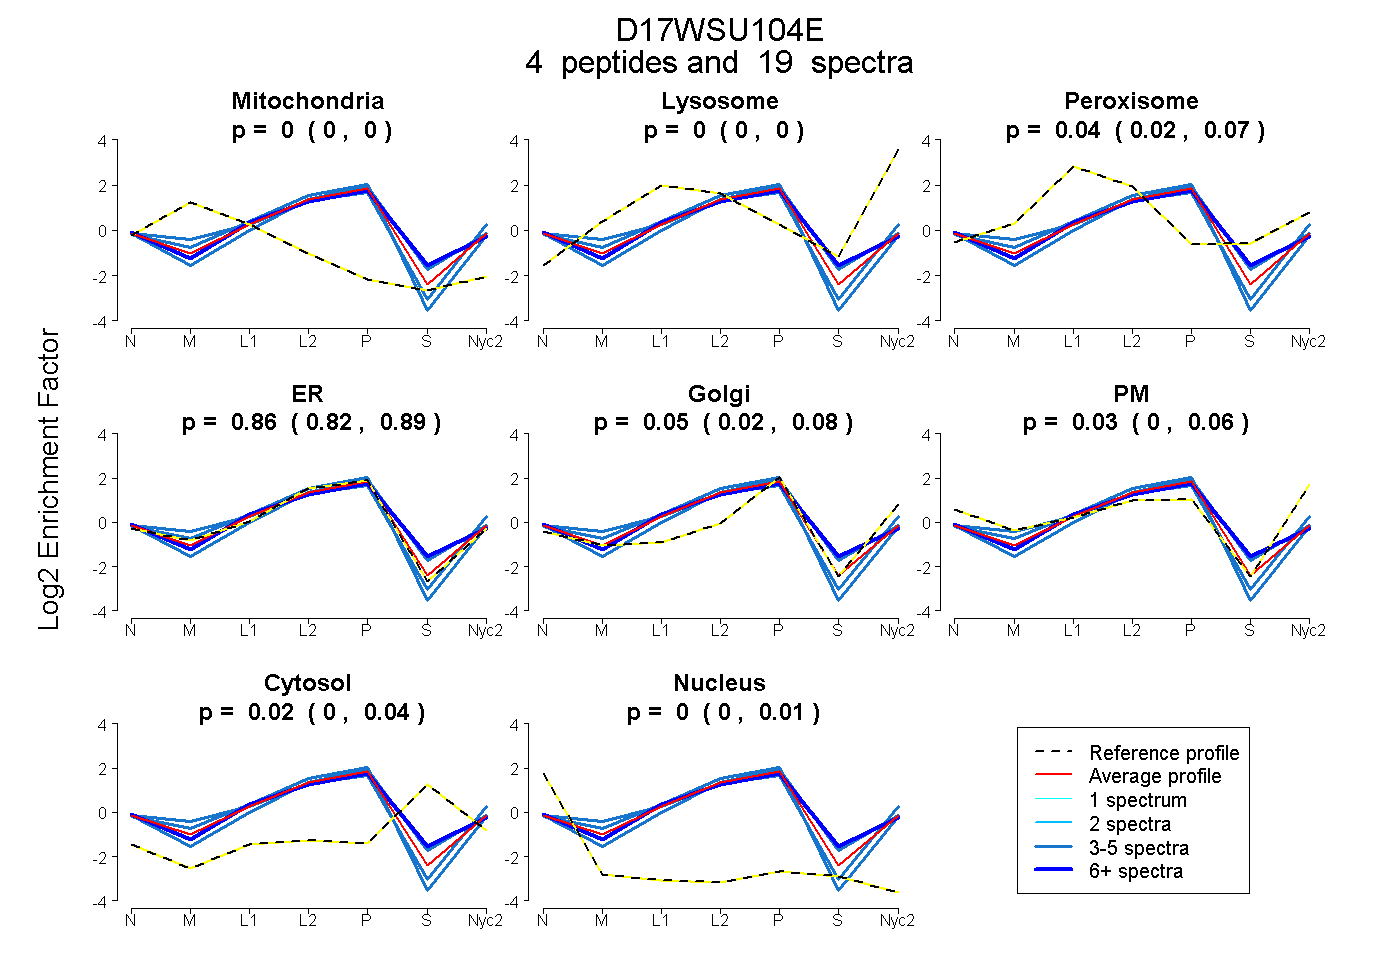
0.000 | 0.000
0.000 | 0.000
0.017 | 0.065
0.817 | 0.885
0.015 | 0.082
0.000 | 0.055
0.000 | 0.039
0.000 | 0.009
2peptides
spectra
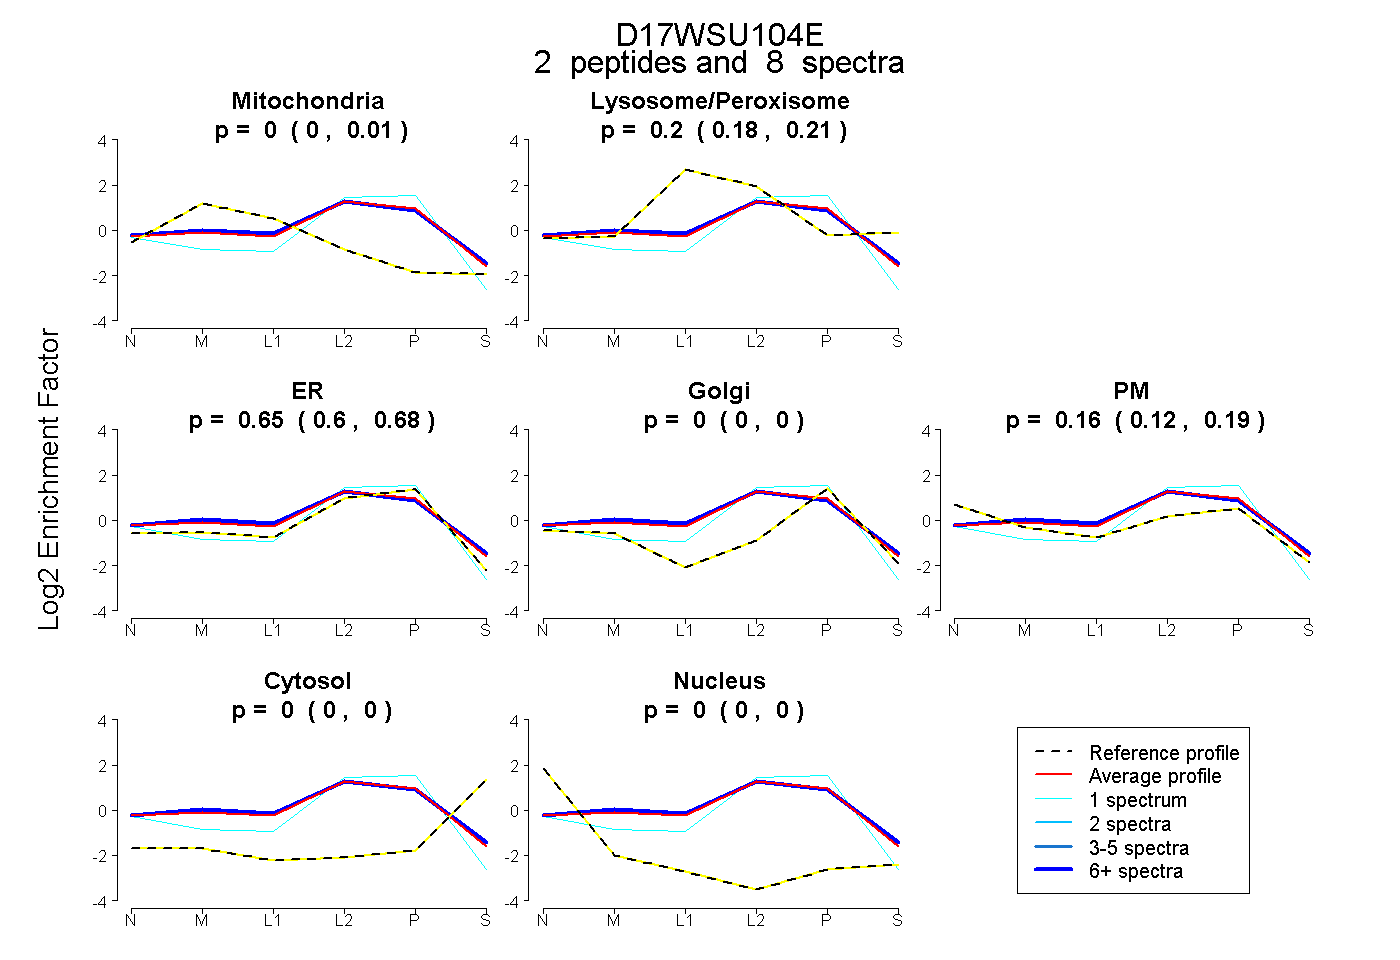
0.000 | 0.006
0.177 | 0.212
0.604 | 0.682
0.000 | 0.000
0.118 | 0.189
0.000 | 0.000
0.000 | 0.000
5peptides
spectra
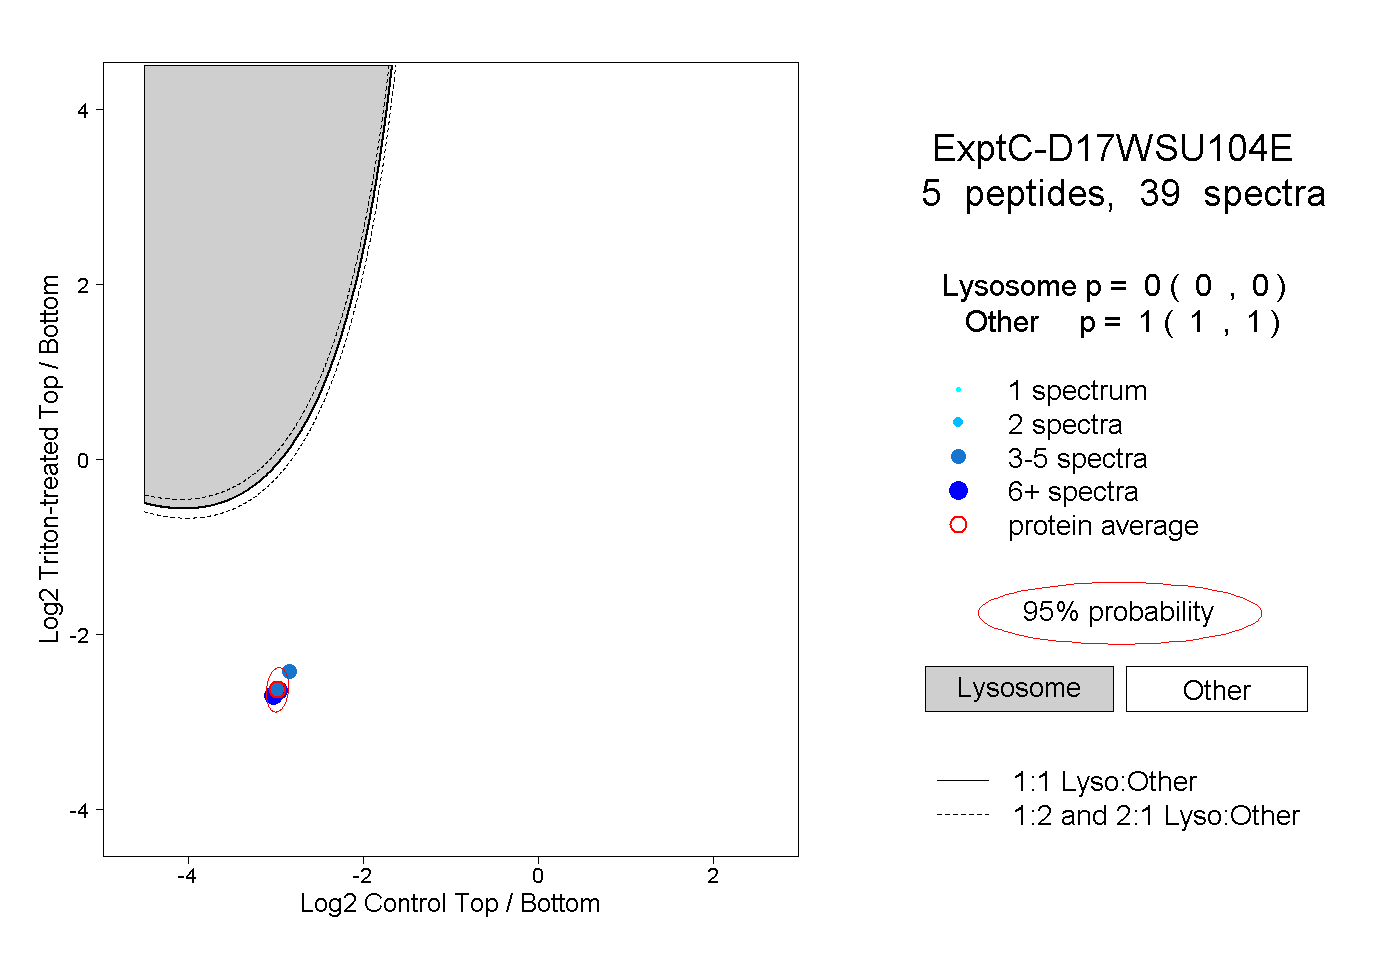
0.000 | 0.000
1.000 | 1.000
1peptide
spectrum
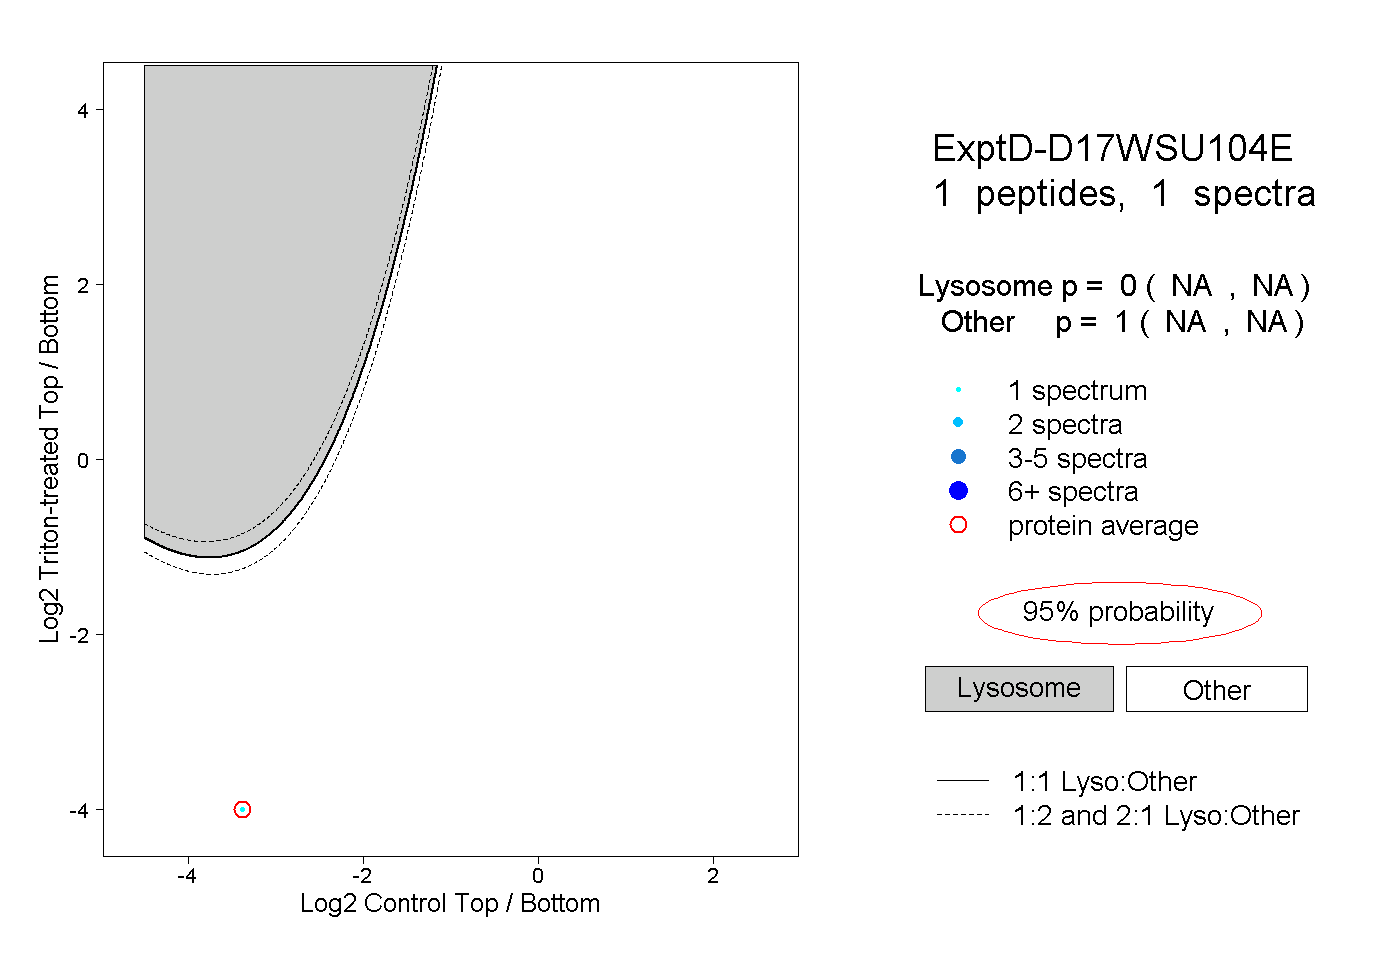
NA | NA
NA | NA