 4
4peptides
spectra
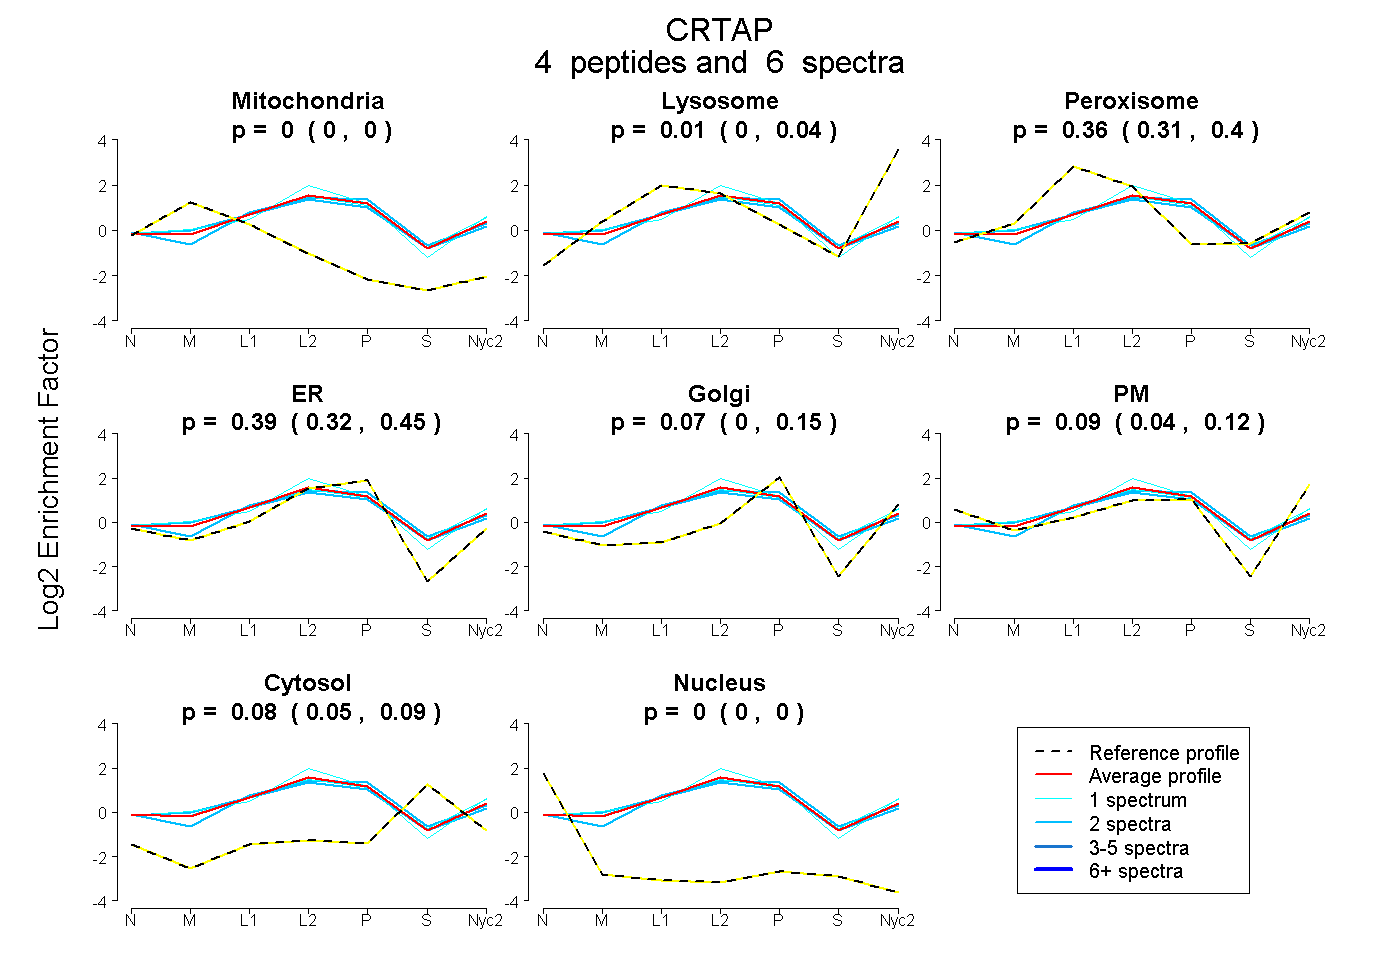
0.000 | 0.000
0.000 | 0.042
0.314 | 0.400
0.324 | 0.452
0.000 | 0.146
0.040 | 0.122
0.052 | 0.095
0.000 | 0.000
| Plot | Mito | Lyso | Perox | ER | Golgi | PM | Cytosol | Nucleus | |||||
| Expt A |
4 peptides |
6 spectra |
|
0.000 0.000 | 0.000 |
0.012 0.000 | 0.042 |
0.365 0.314 | 0.400 |
0.392 0.324 | 0.452 |
0.069 0.000 | 0.146 |
0.086 0.040 | 0.122 |
0.075 0.052 | 0.095 |
0.000 0.000 | 0.000 |
| 2 spectra, AIAAAHTYLLK | 0.000 | 0.000 | 0.370 | 0.401 | 0.134 | 0.000 | 0.095 | 0.000 | ||
| 1 spectrum, AVLADFQQR | 0.000 | 0.017 | 0.379 | 0.291 | 0.110 | 0.128 | 0.075 | 0.000 | ||
| 1 spectrum, LFGGVLR | 0.000 | 0.084 | 0.271 | 0.482 | 0.000 | 0.142 | 0.022 | 0.000 | ||
| 2 spectra, DSEAFCHR | 0.000 | 0.000 | 0.406 | 0.370 | 0.120 | 0.019 | 0.085 | 0.000 |
| Plot | Lyso | Other | |||||||||||
| Expt C |
5 peptides |
10 spectra |
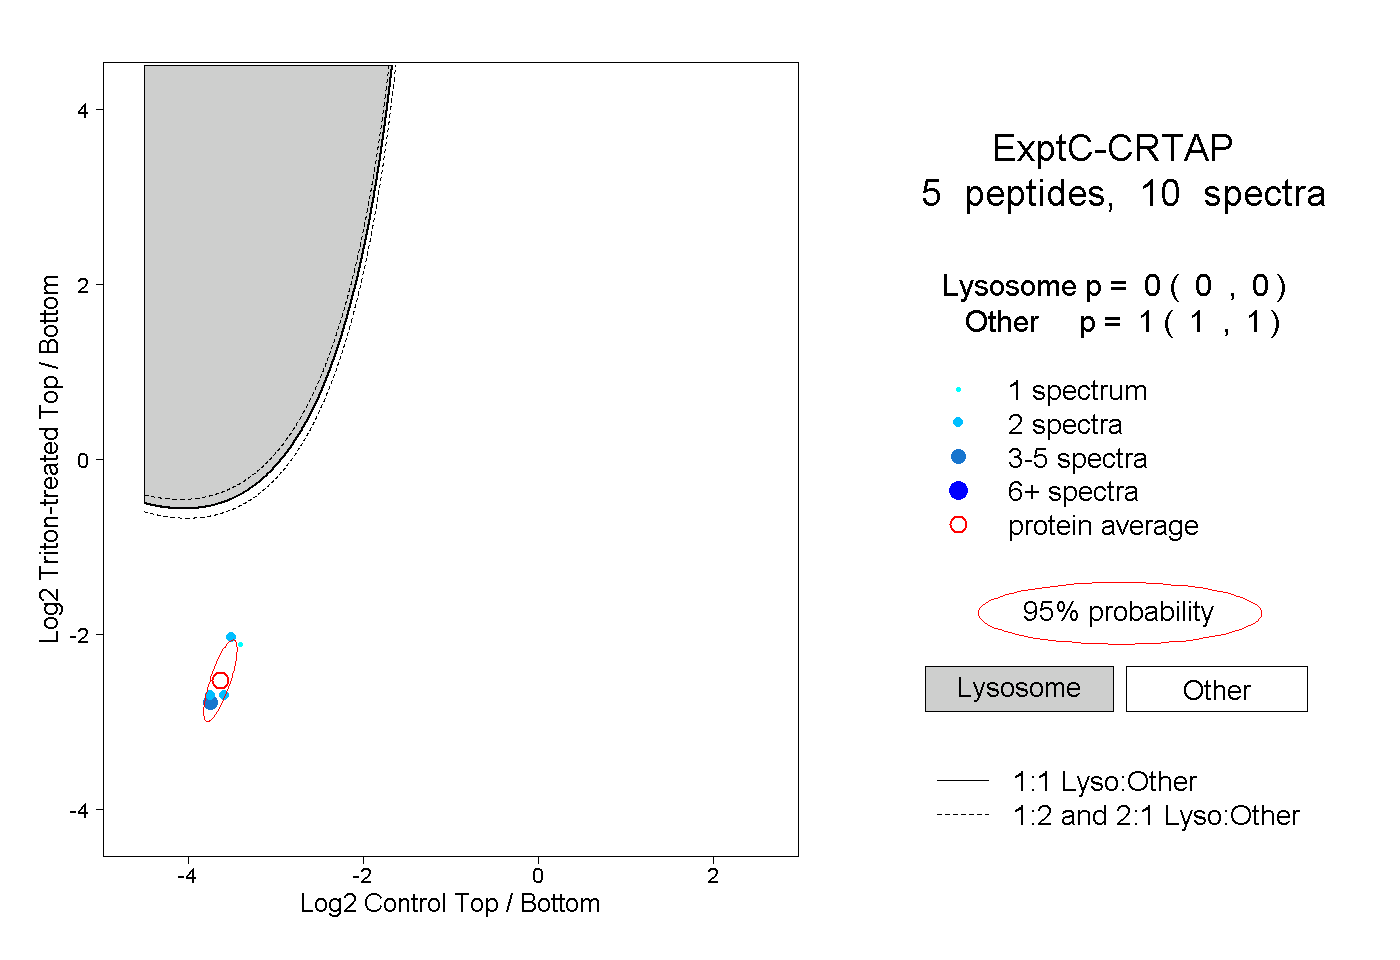 |
0.000 0.000 | 0.000 |
1.000 1.000 | 1.000 |