 1
1peptide
spectra
0.000 | 0.057
0.000 | 0.143
0.000 | 0.000
0.404 | 0.800
0.000 | 0.374
0.000 | 0.195
0.000 | 0.000
0.000 | 0.106
1peptide
spectrum
NA | NA
NA | NA
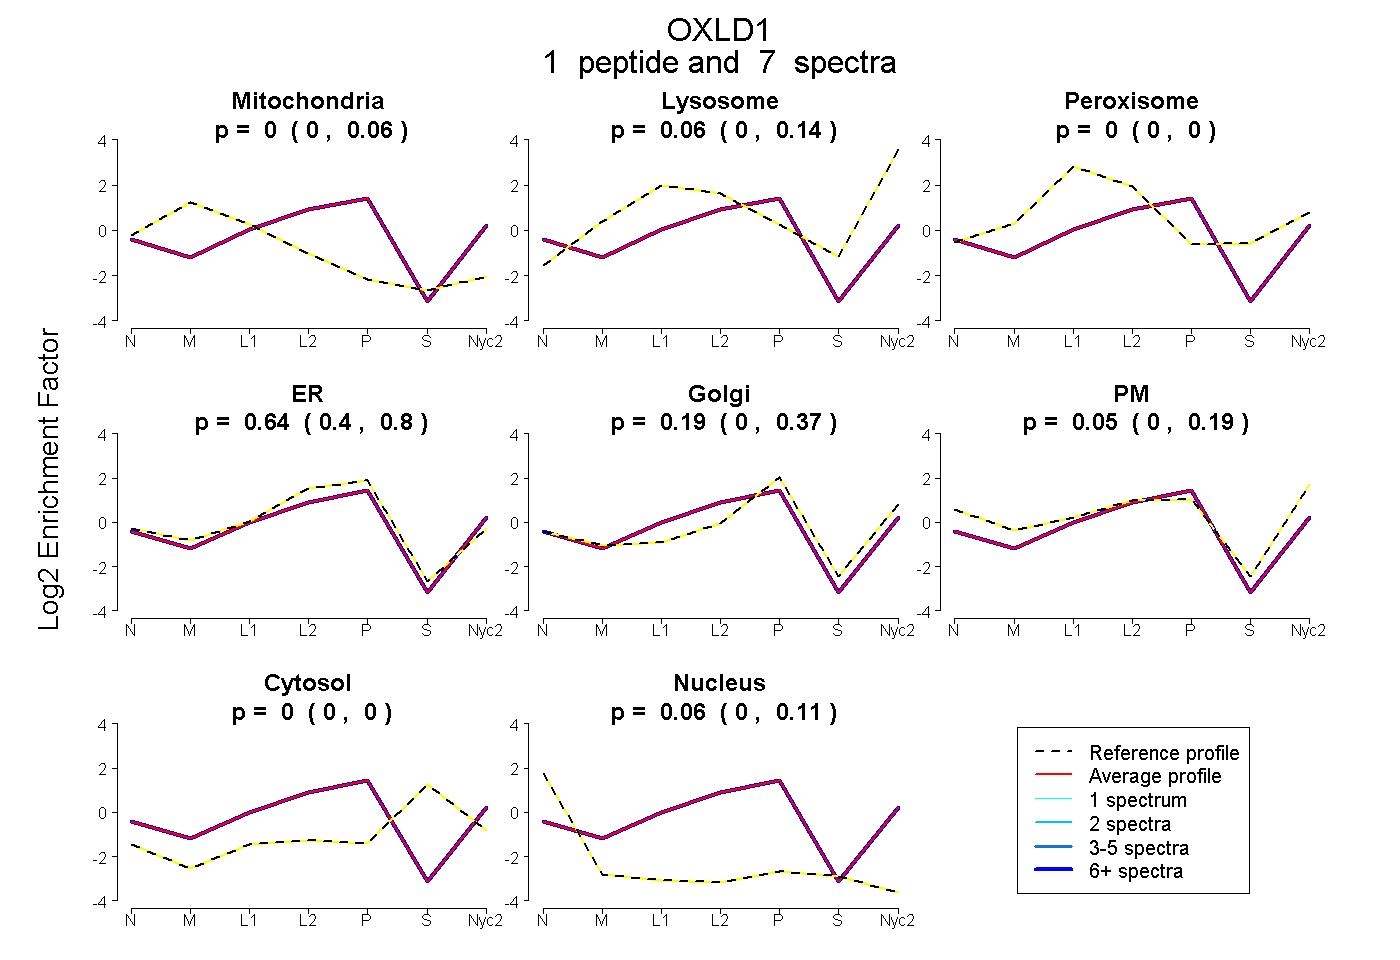
| Plot | Mito | Lyso | Perox | ER | Golgi | PM | Cytosol | Nucleus | |||||
| Expt A |
1 peptide |
7 spectra |
|
0.000 0.000 | 0.057 |
0.061 0.000 | 0.143 |
0.000 0.000 | 0.000 |
0.643 0.404 | 0.800 |
0.189 0.000 | 0.374 |
0.052 0.000 | 0.195 |
0.000 0.000 | 0.000 |
0.056 0.000 | 0.106 |
||
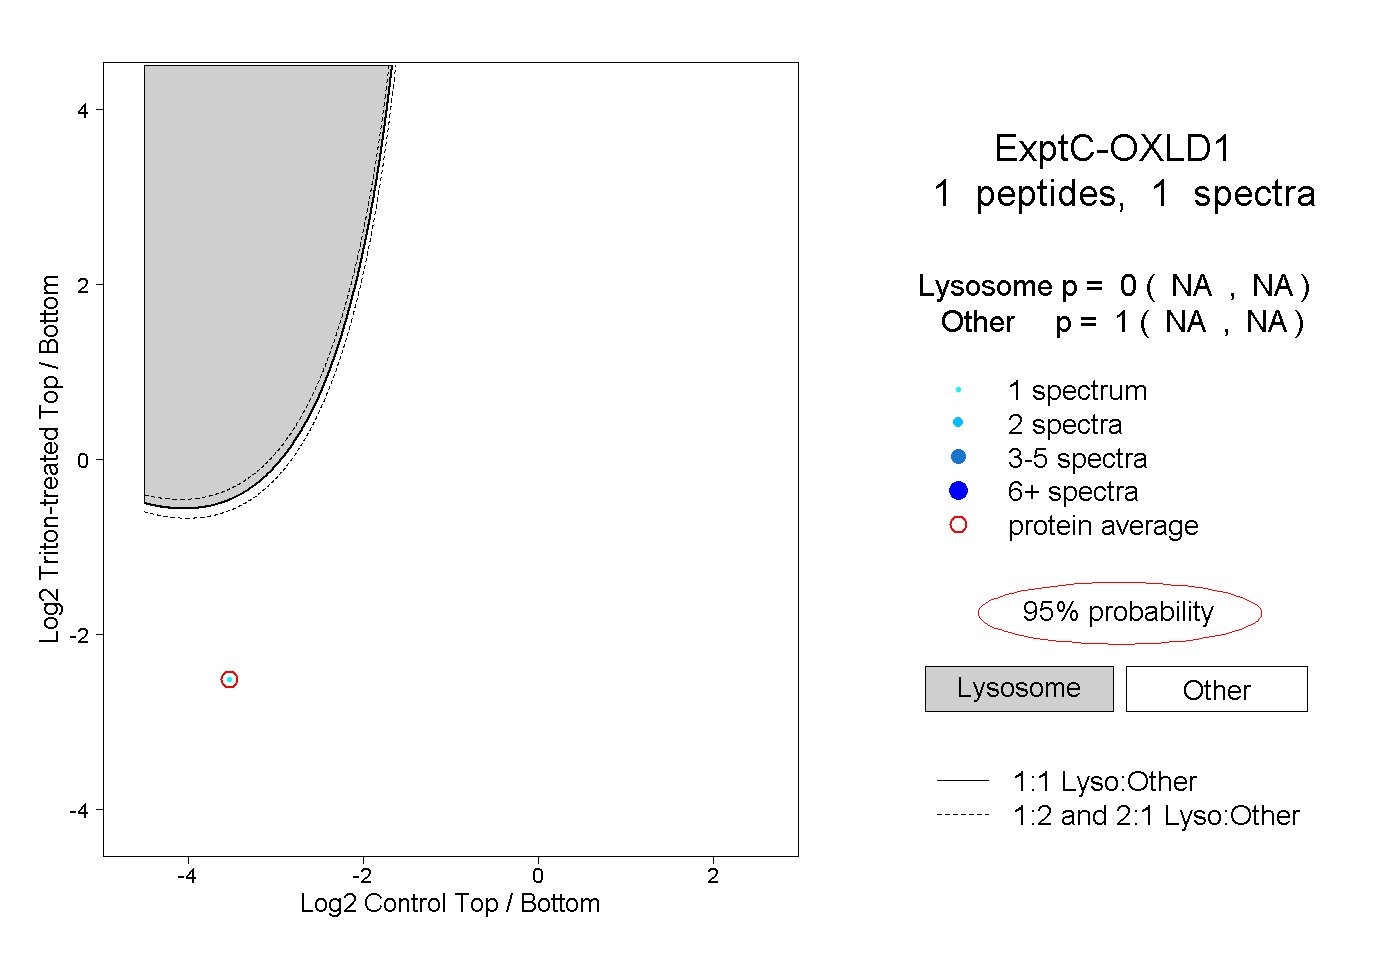
| Plot | Lyso | Other | |||||||||||
| Expt C |
1 peptide |
1 spectrum |
|
0.000 NA | NA |
1.000 NA | NA |