 1
1peptide
spectra
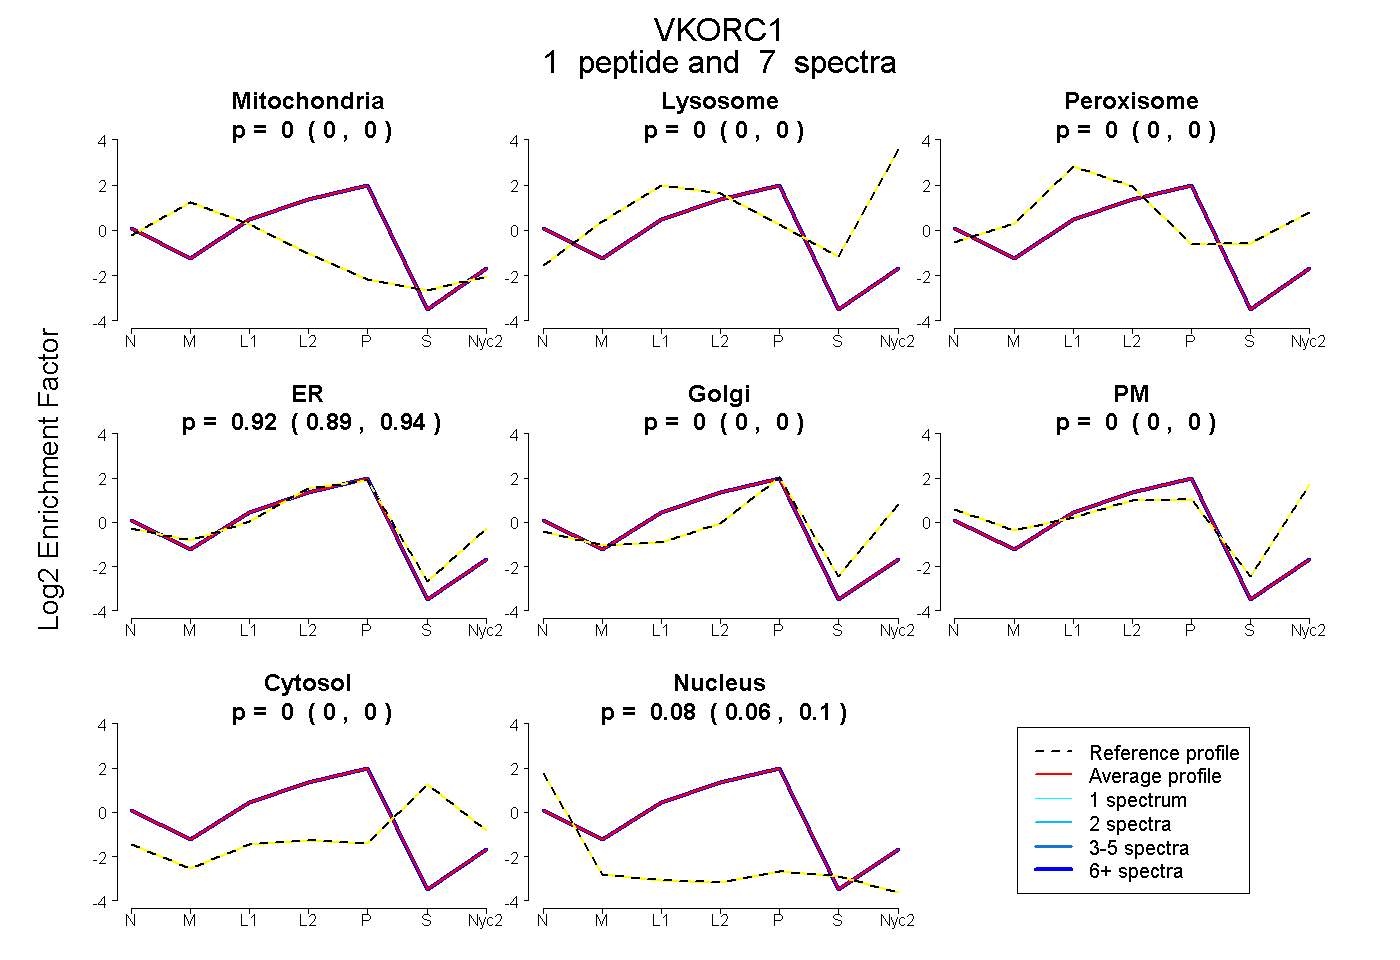
0.000 | 0.000
0.000 | 0.000
0.000 | 0.000
0.894 | 0.938
0.000 | 0.000
0.000 | 0.000
0.000 | 0.000
0.058 | 0.104
1peptide
spectra
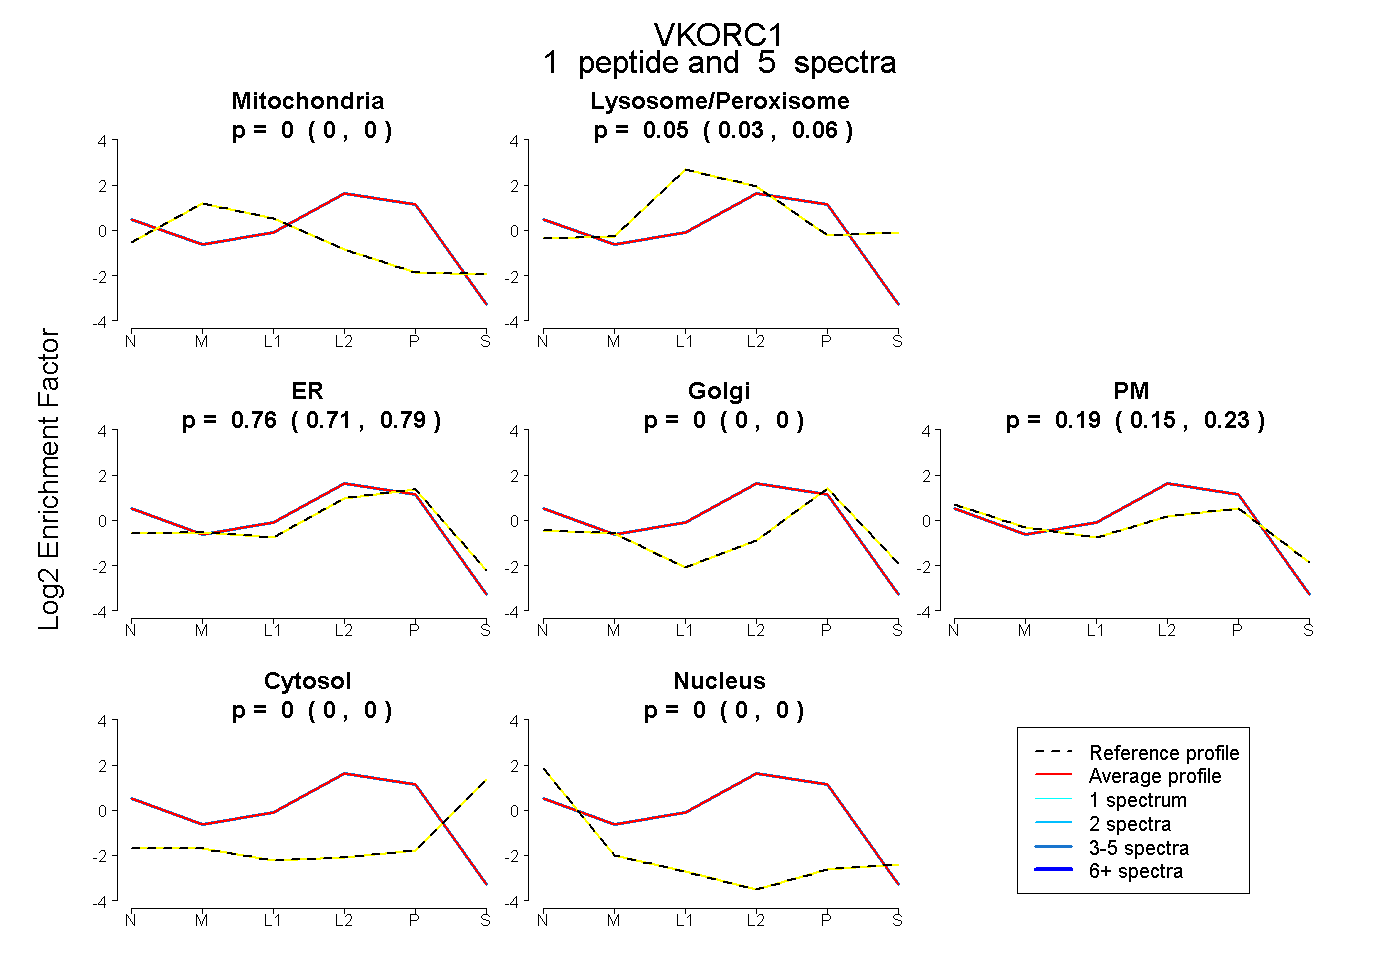
0.000 | 0.000
0.032 | 0.065
0.712 | 0.792
0.000 | 0.000
0.147 | 0.231
0.000 | 0.000
0.000 | 0.000
2peptides
spectra
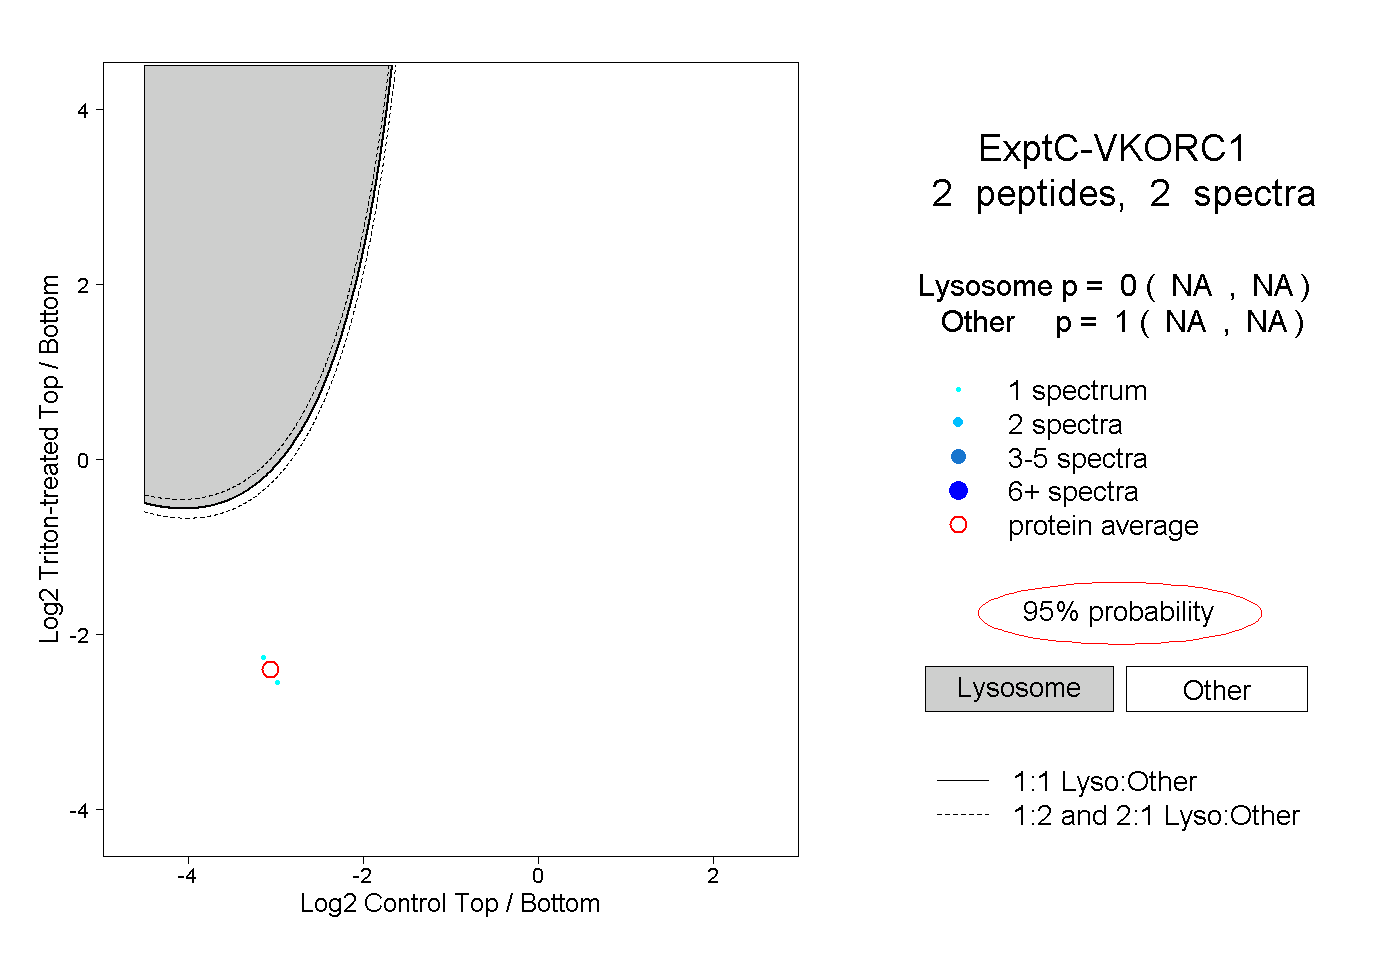
NA | NA
NA | NA
1peptide
spectra
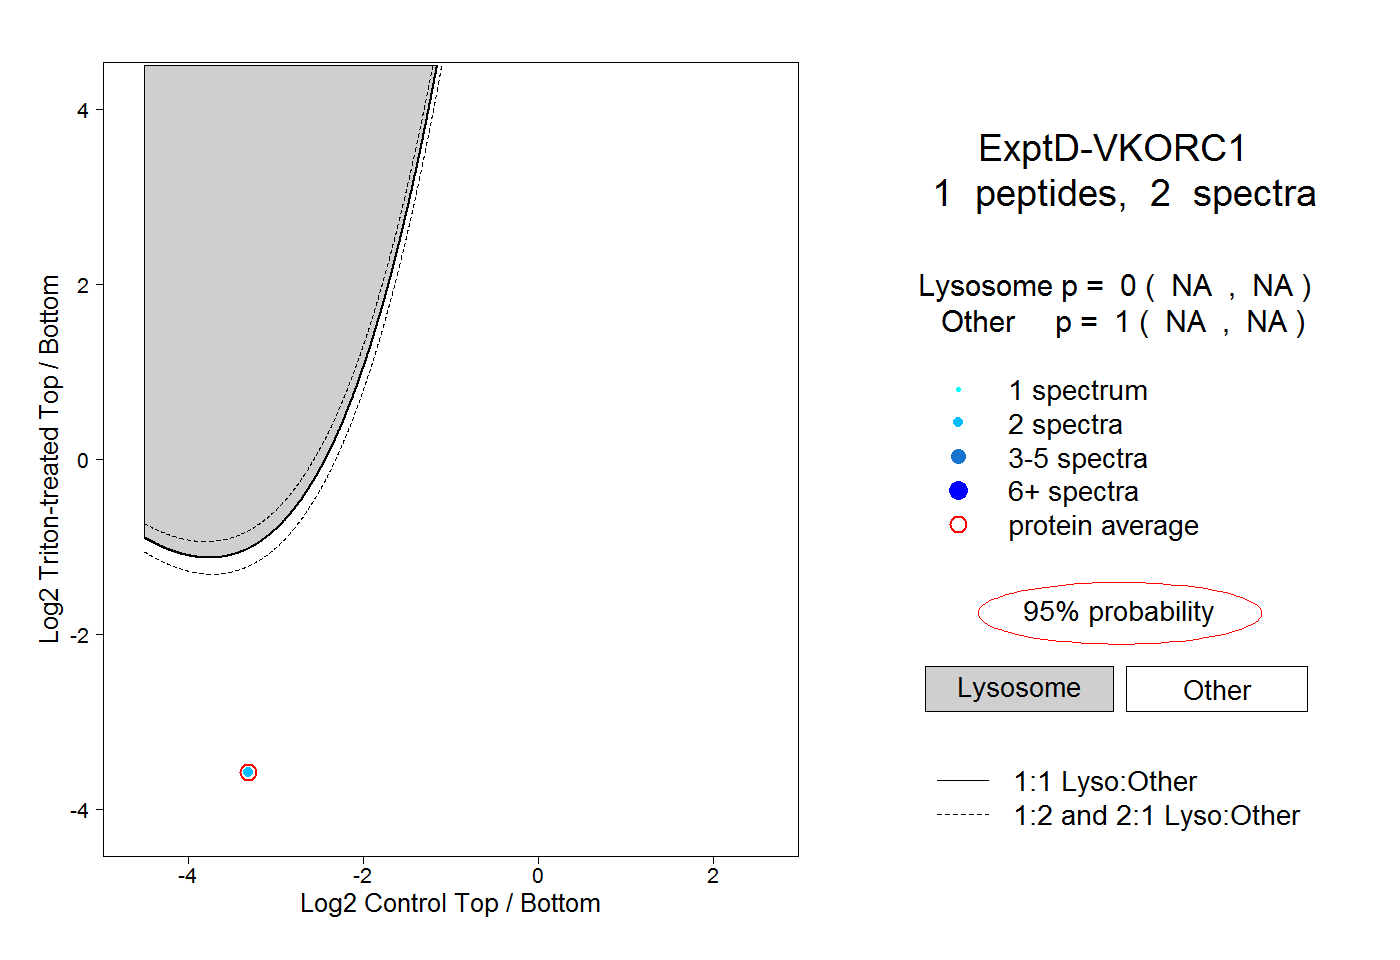
NA | NA
NA | NA