 1
1peptide
spectrum
NA | NA
NA | NA
NA | NA
NA | NA
NA | NA
NA | NA
NA | NA
NA | NA
| Plot | Mito | Lyso | Perox | ER | Golgi | PM | Cytosol | Nucleus | |||||
| Expt A |
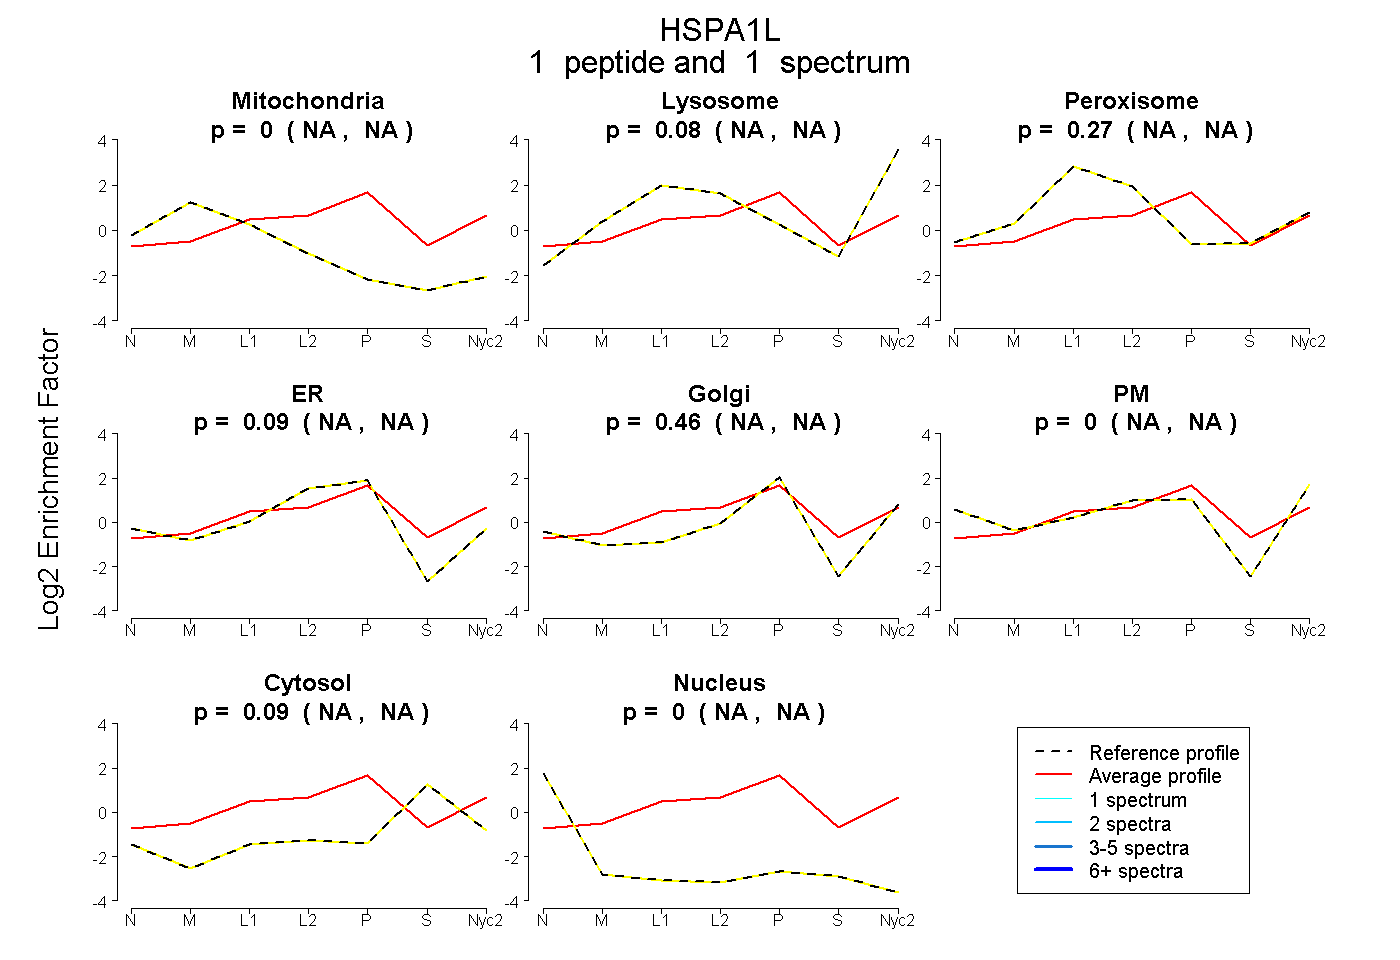
1 peptide |
1 spectrum |
|
0.000 NA | NA |
0.080 NA | NA |
0.275 NA | NA |
0.087 NA | NA |
0.464 NA | NA |
0.000 NA | NA |
0.094 NA | NA |
0.000 NA | NA |
| 1 spectrum, NQVAMNPQNTVFDAK | 0.000 | 0.080 | 0.275 | 0.087 | 0.464 | 0.000 | 0.094 | 0.000 |
| Plot | Mito | Lyso or Perox | ER | Golgi | PM | Cytosol | Nucleus | ||||||
| Expt B |
3 peptides |
6 spectra |
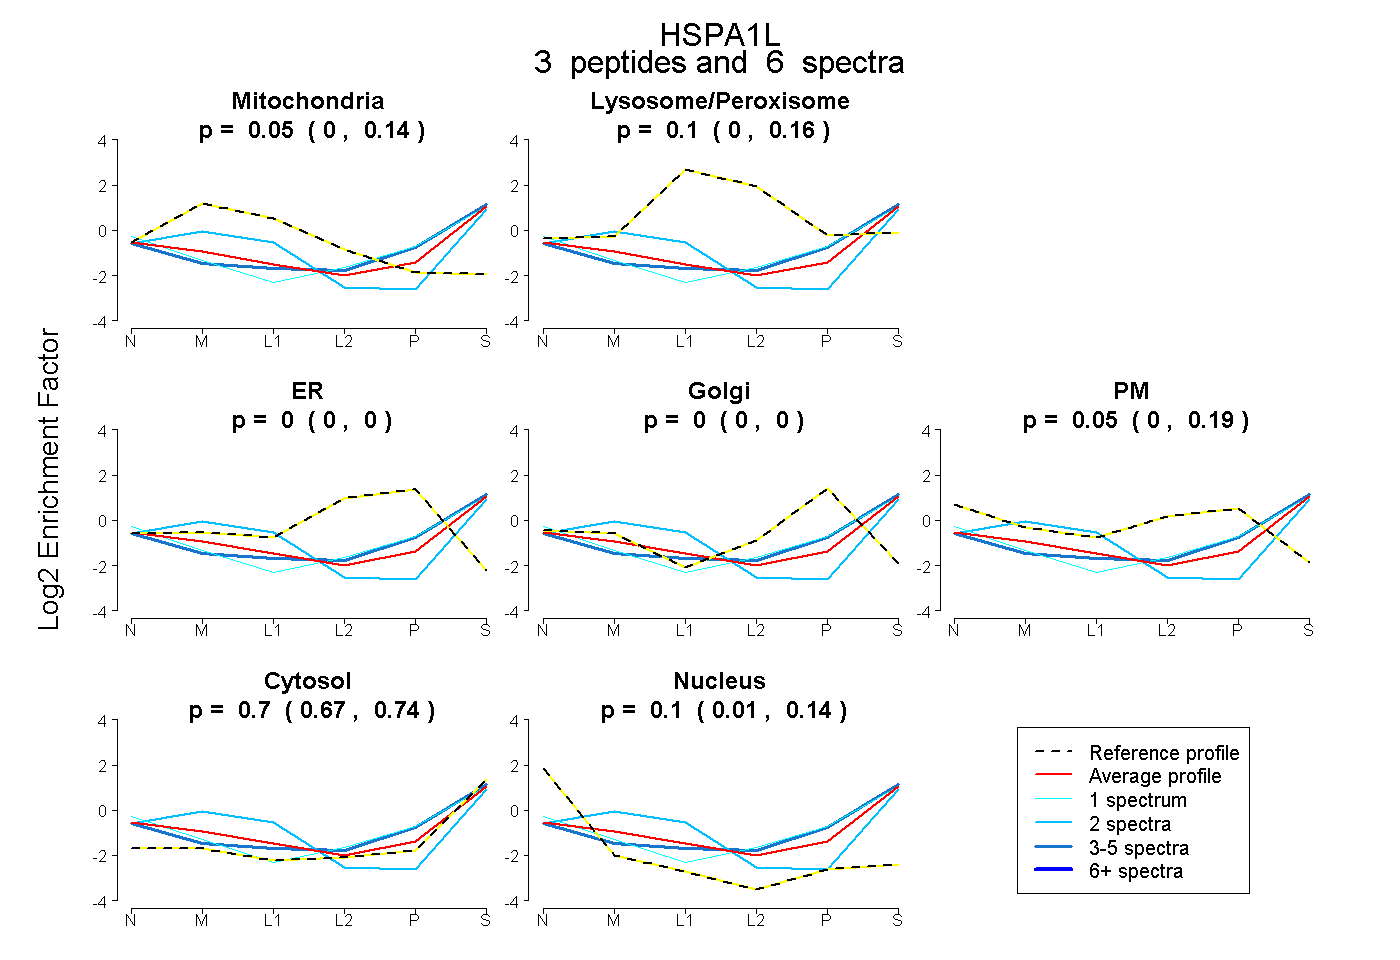 |
0.047 0.000 | 0.145 |
0.099 0.000 | 0.162 |
0.000 0.000 | 0.000 |
0.000 0.000 | 0.000 |
0.047 0.000 | 0.188 |
0.705 0.666 | 0.740 |
0.103 0.007 | 0.145 |