 1
1peptide
spectrum
NA | NA
NA | NA
NA | NA
NA | NA
NA | NA
NA | NA
NA | NA
NA | NA
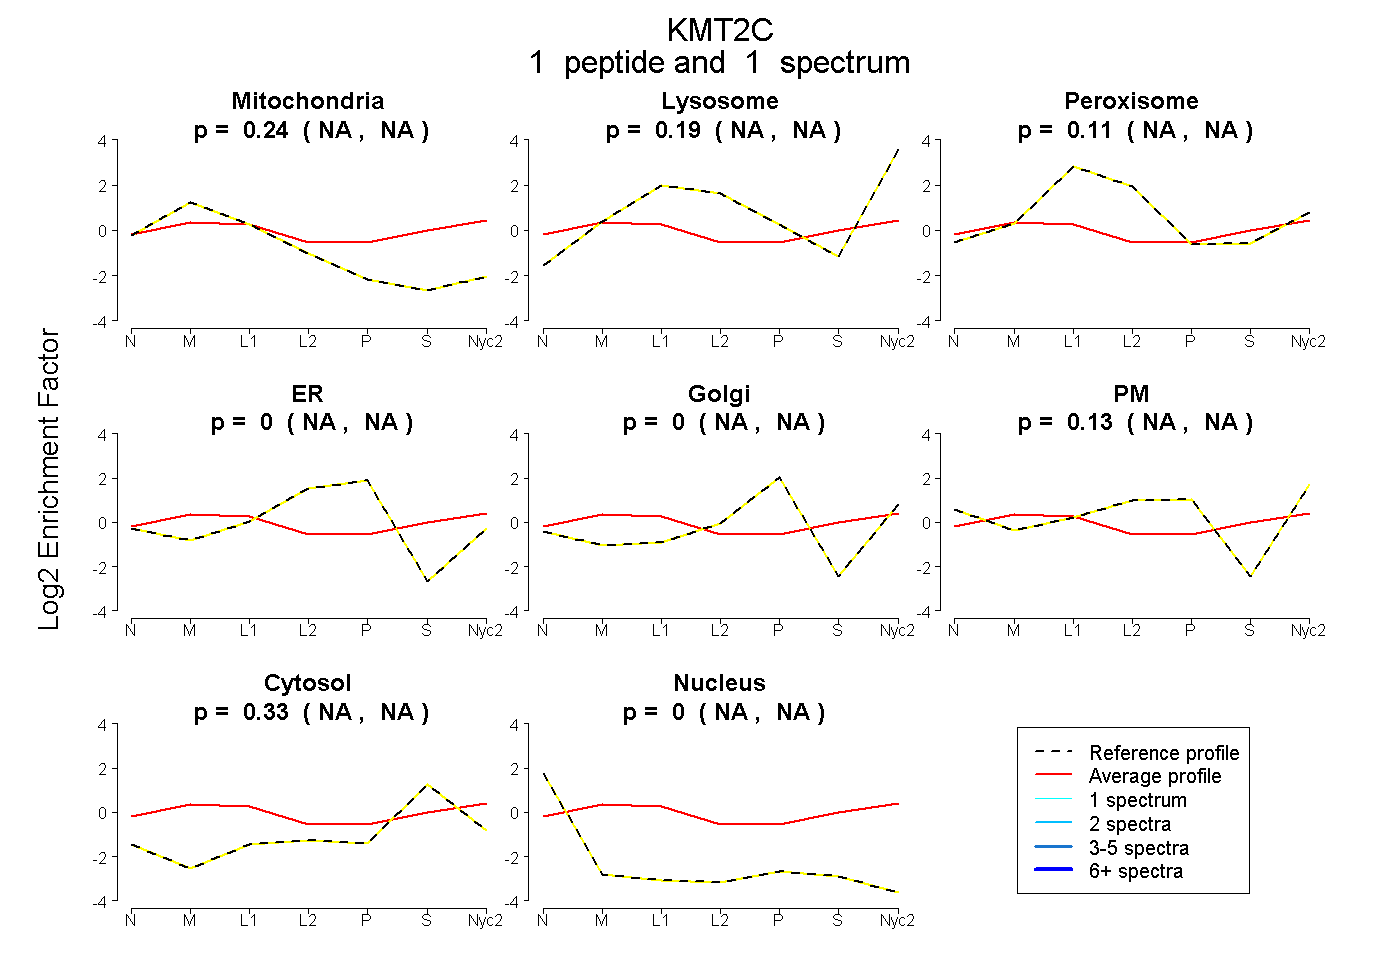
| Plot | Mito | Lyso | Perox | ER | Golgi | PM | Cytosol | Nucleus | |||||
| Expt A |
1 peptide |
1 spectrum |
|
0.237 NA | NA |
0.193 NA | NA |
0.115 NA | NA |
0.000 NA | NA |
0.000 NA | NA |
0.128 NA | NA |
0.328 NA | NA |
0.000 NA | NA |
| 1 spectrum, VVILGSGVR | 0.237 | 0.193 | 0.115 | 0.000 | 0.000 | 0.128 | 0.328 | 0.000 |
| Plot | Mito | Lyso or Perox | ER | Golgi | PM | Cytosol | Nucleus | ||||||
| Expt B |
1 peptide |
1 spectrum |
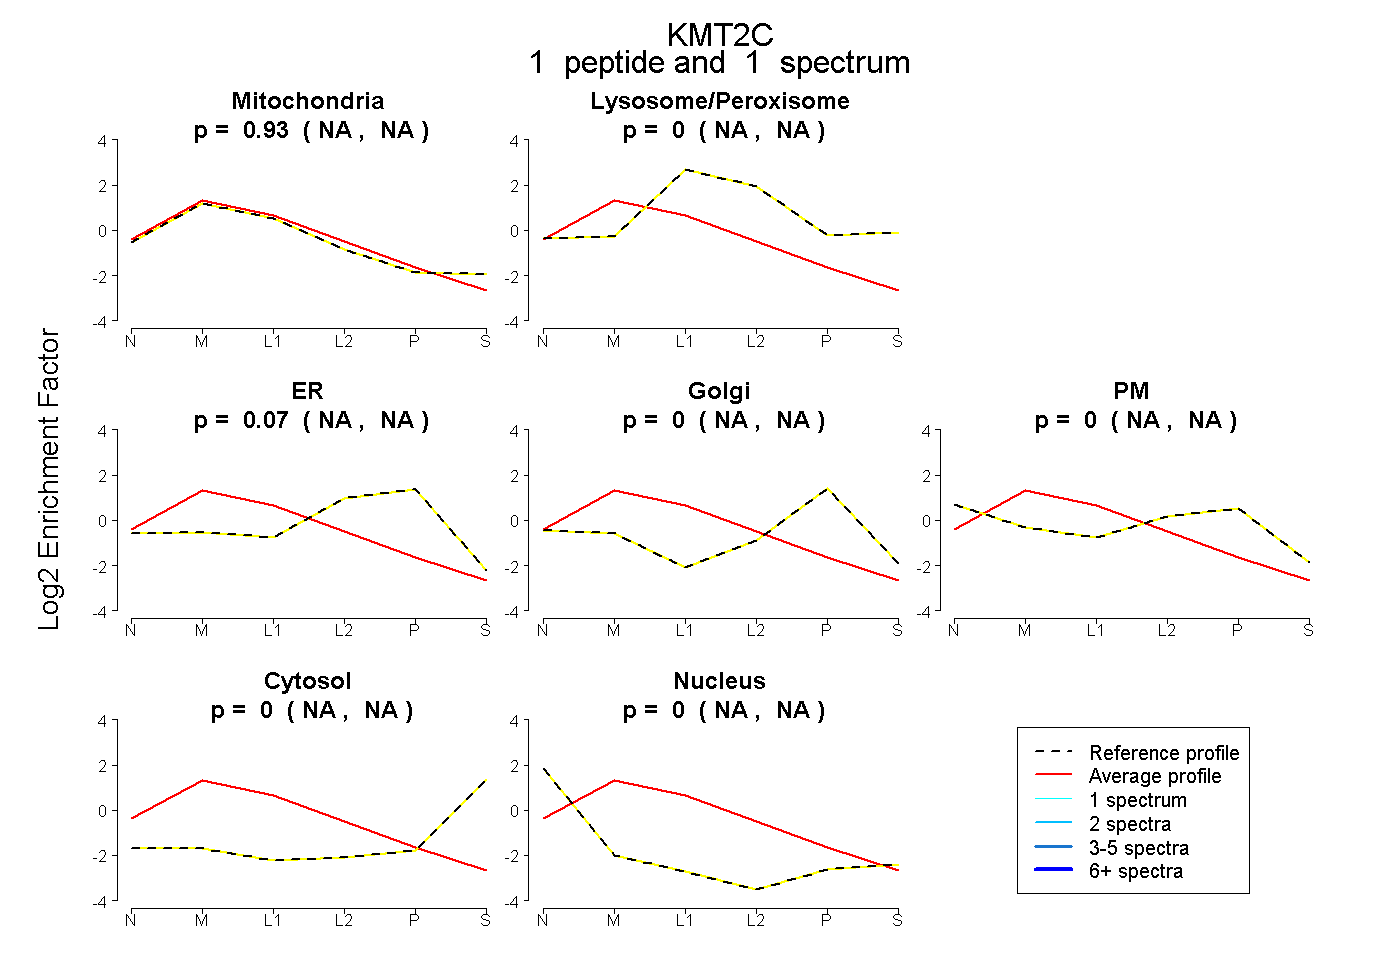 |
0.933 NA | NA |
0.000 NA | NA |
0.067 NA | NA |
0.000 NA | NA |
0.000 NA | NA |
0.000 NA | NA |
0.000 NA | NA |