 16
16peptides
spectra
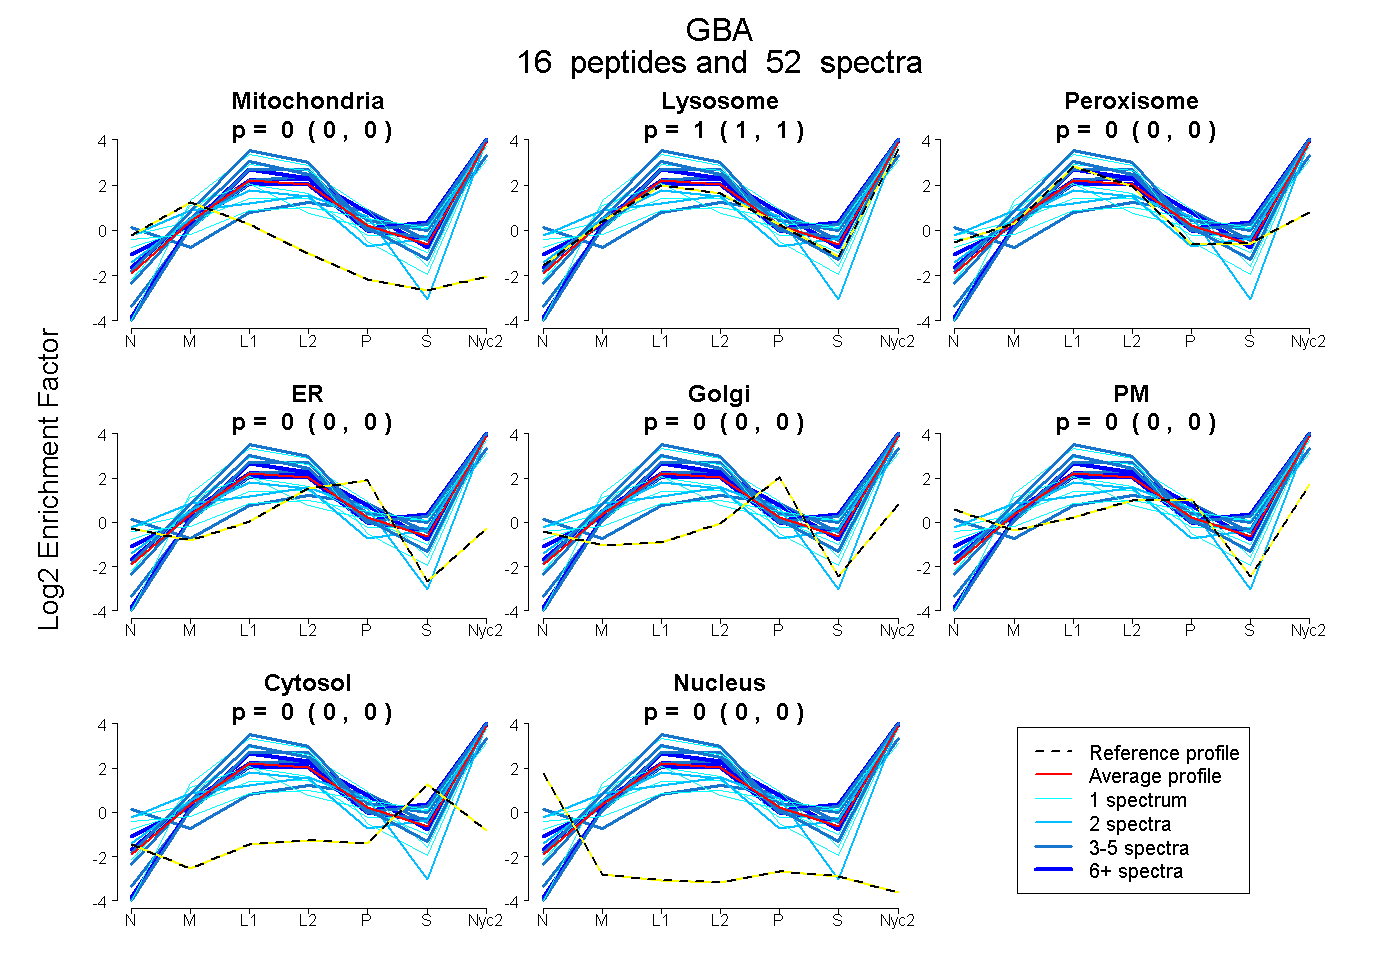
0.000 | 0.000
1.000 | 1.000
0.000 | 0.000
0.000 | 0.000
0.000 | 0.000
0.000 | 0.000
0.000 | 0.000
0.000 | 0.000
| Plot | Mito | Lyso | Perox | ER | Golgi | PM | Cytosol | Nucleus | |||||
| Expt A |
16 peptides |
52 spectra |
|
0.000 0.000 | 0.000 |
1.000 1.000 | 1.000 |
0.000 0.000 | 0.000 |
0.000 0.000 | 0.000 |
0.000 0.000 | 0.000 |
0.000 0.000 | 0.000 |
0.000 0.000 | 0.000 |
0.000 0.000 | 0.000 |
| 2 spectra, TNGAVNGK | 0.000 | 0.596 | 0.000 | 0.000 | 0.000 | 0.404 | 0.000 | 0.000 | ||
| 7 spectra, FIPEGSQR | 0.000 | 0.977 | 0.023 | 0.000 | 0.000 | 0.000 | 0.000 | 0.000 | ||
| 4 spectra, FWEQSVR | 0.000 | 1.000 | 0.000 | 0.000 | 0.000 | 0.000 | 0.000 | 0.000 | ||
| 1 spectrum, QPMFYHLGHFSK | 0.000 | 1.000 | 0.000 | 0.000 | 0.000 | 0.000 | 0.000 | 0.000 | ||
| 4 spectra, SYFSSEGIEYNIIR | 0.000 | 1.000 | 0.000 | 0.000 | 0.000 | 0.000 | 0.000 | 0.000 | ||
| 5 spectra, VPMASCDFSIR | 0.000 | 0.983 | 0.017 | 0.000 | 0.000 | 0.000 | 0.000 | 0.000 | ||
| 1 spectrum, WAQVVLSDPEAAK | 0.000 | 0.755 | 0.000 | 0.000 | 0.000 | 0.105 | 0.140 | 0.000 | ||
| 9 spectra, IPLIHR | 0.000 | 1.000 | 0.000 | 0.000 | 0.000 | 0.000 | 0.000 | 0.000 | ||
| 3 spectra, LGSWDR | 0.000 | 1.000 | 0.000 | 0.000 | 0.000 | 0.000 | 0.000 | 0.000 | ||
| 1 spectrum, LLILDDQR | 0.000 | 1.000 | 0.000 | 0.000 | 0.000 | 0.000 | 0.000 | 0.000 | ||
| 1 spectrum, TGTGLLLTLQPEEK | 0.000 | 1.000 | 0.000 | 0.000 | 0.000 | 0.000 | 0.000 | 0.000 | ||
| 2 spectra, TDLETVALIRPDGSAVVVVLNR | 0.000 | 0.961 | 0.000 | 0.000 | 0.000 | 0.000 | 0.039 | 0.000 | ||
| 1 spectrum, GHPGDIYHEAWANYFVK | 0.000 | 0.967 | 0.000 | 0.000 | 0.000 | 0.000 | 0.033 | 0.000 | ||
| 1 spectrum, LFPNMMLFASEACVGSK | 0.000 | 0.674 | 0.152 | 0.000 | 0.000 | 0.092 | 0.082 | 0.000 | ||
| 4 spectra, ATLGETHR | 0.000 | 0.532 | 0.000 | 0.000 | 0.000 | 0.376 | 0.092 | 0.000 | ||
| 6 spectra, FLDAYATHNIK | 0.000 | 1.000 | 0.000 | 0.000 | 0.000 | 0.000 | 0.000 | 0.000 |
| Plot | Mito | Lyso or Perox | ER | Golgi | PM | Cytosol | Nucleus | ||||||
| Expt B |
12 peptides |
24 spectra |
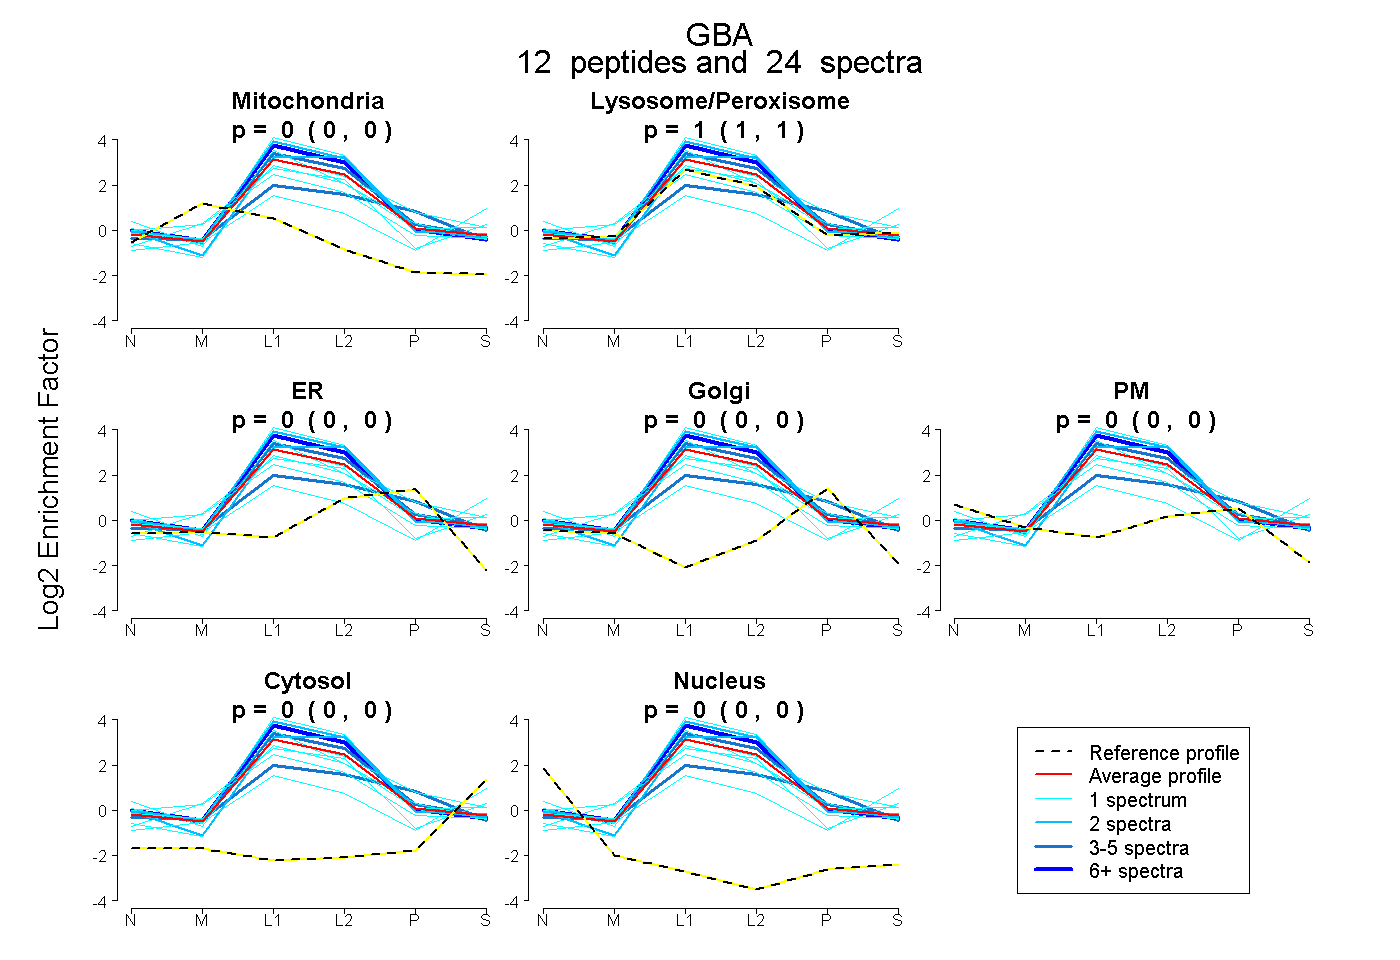 |
0.000 0.000 | 0.000 |
1.000 1.000 | 1.000 |
0.000 0.000 | 0.000 |
0.000 0.000 | 0.000 |
0.000 0.000 | 0.000 |
0.000 0.000 | 0.000 |
0.000 0.000 | 0.000 |
|||
| Plot | Lyso | Other | |||||||||||
| Expt C |
16 peptides |
240 spectra |
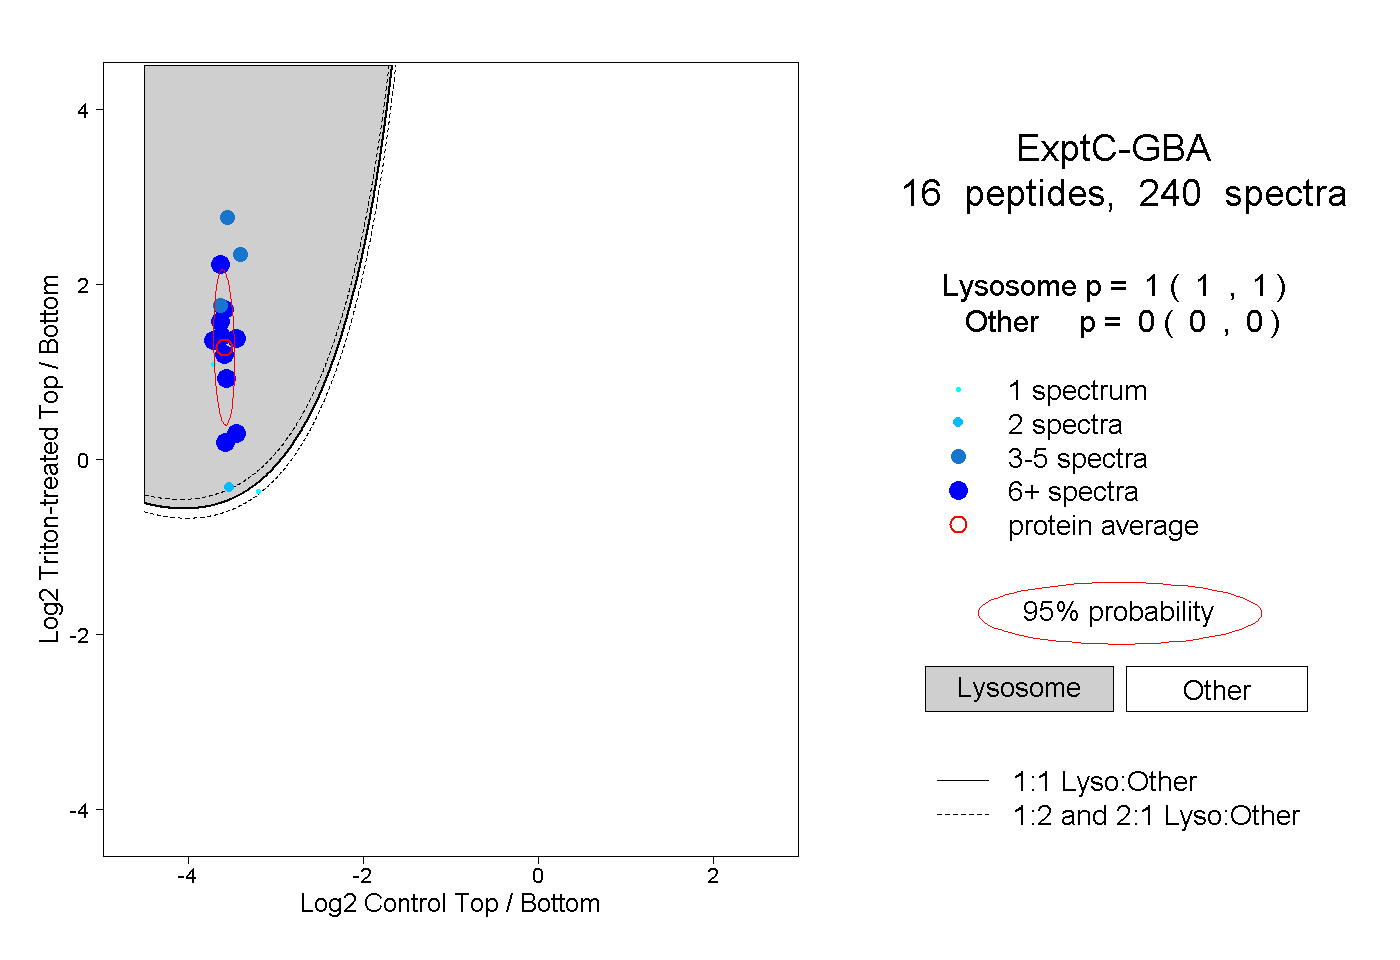 |
1.000 1.000 | 1.000 |
0.000 0.000 | 0.000 |
||||||||
| Plot | Lyso | Other | |||||||||||
| Expt D |
9 peptides |
25 spectra |
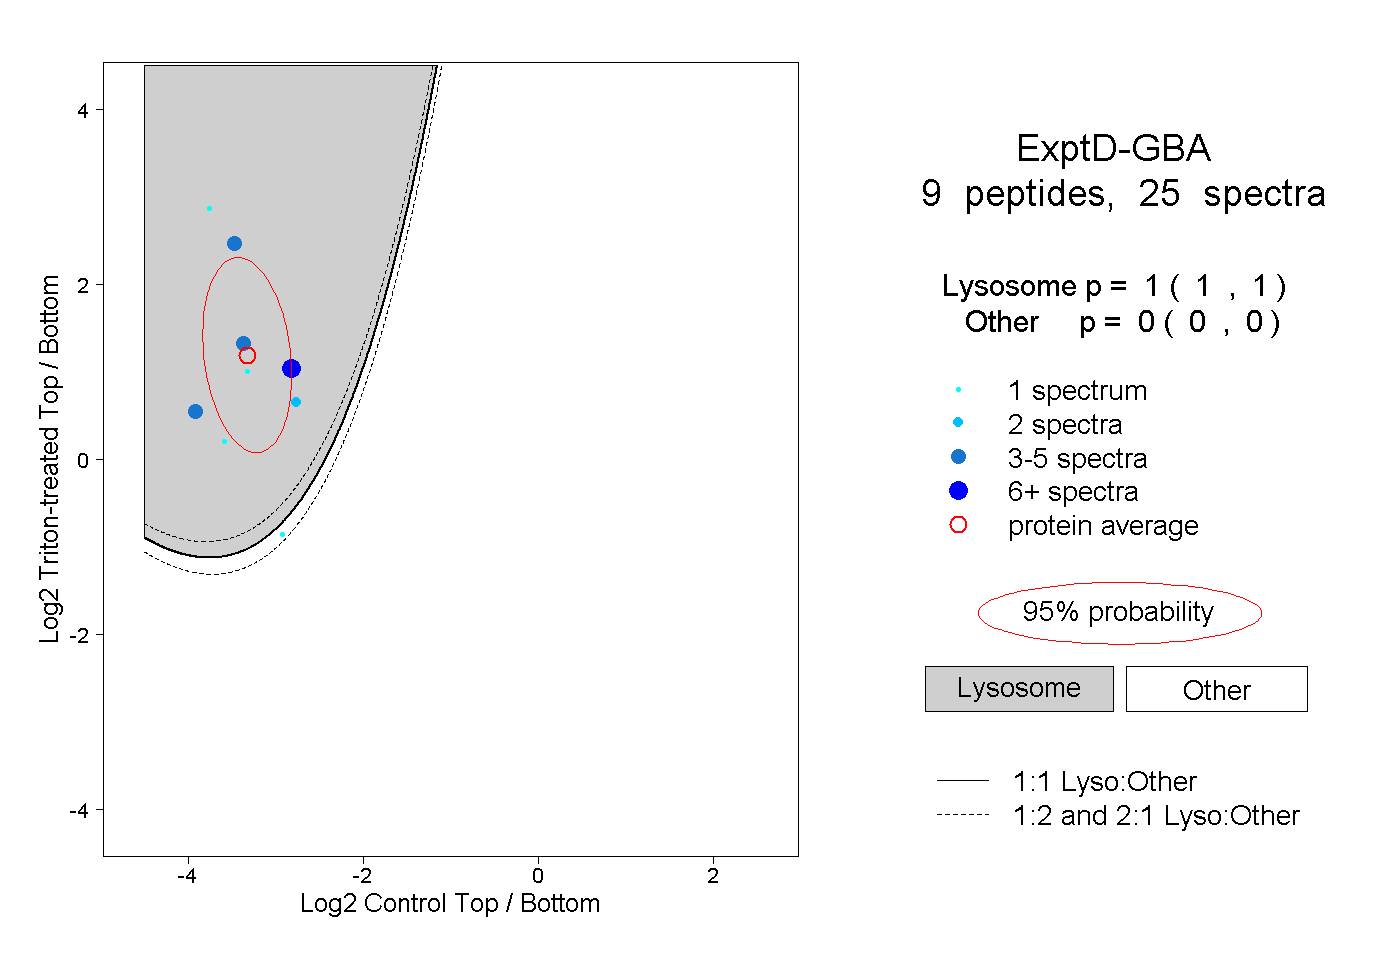 |
1.000 1.000 | 1.000 |
0.000 0.000 | 0.000 |