 4
4peptides
spectra
0.000 | 0.000
0.000 | 0.000
0.000 | 0.000
0.014 | 0.089
0.000 | 0.022
0.504 | 0.565
0.275 | 0.294
0.106 | 0.127
| Plot | Mito | Lyso | Perox | ER | Golgi | PM | Cytosol | Nucleus | |||||
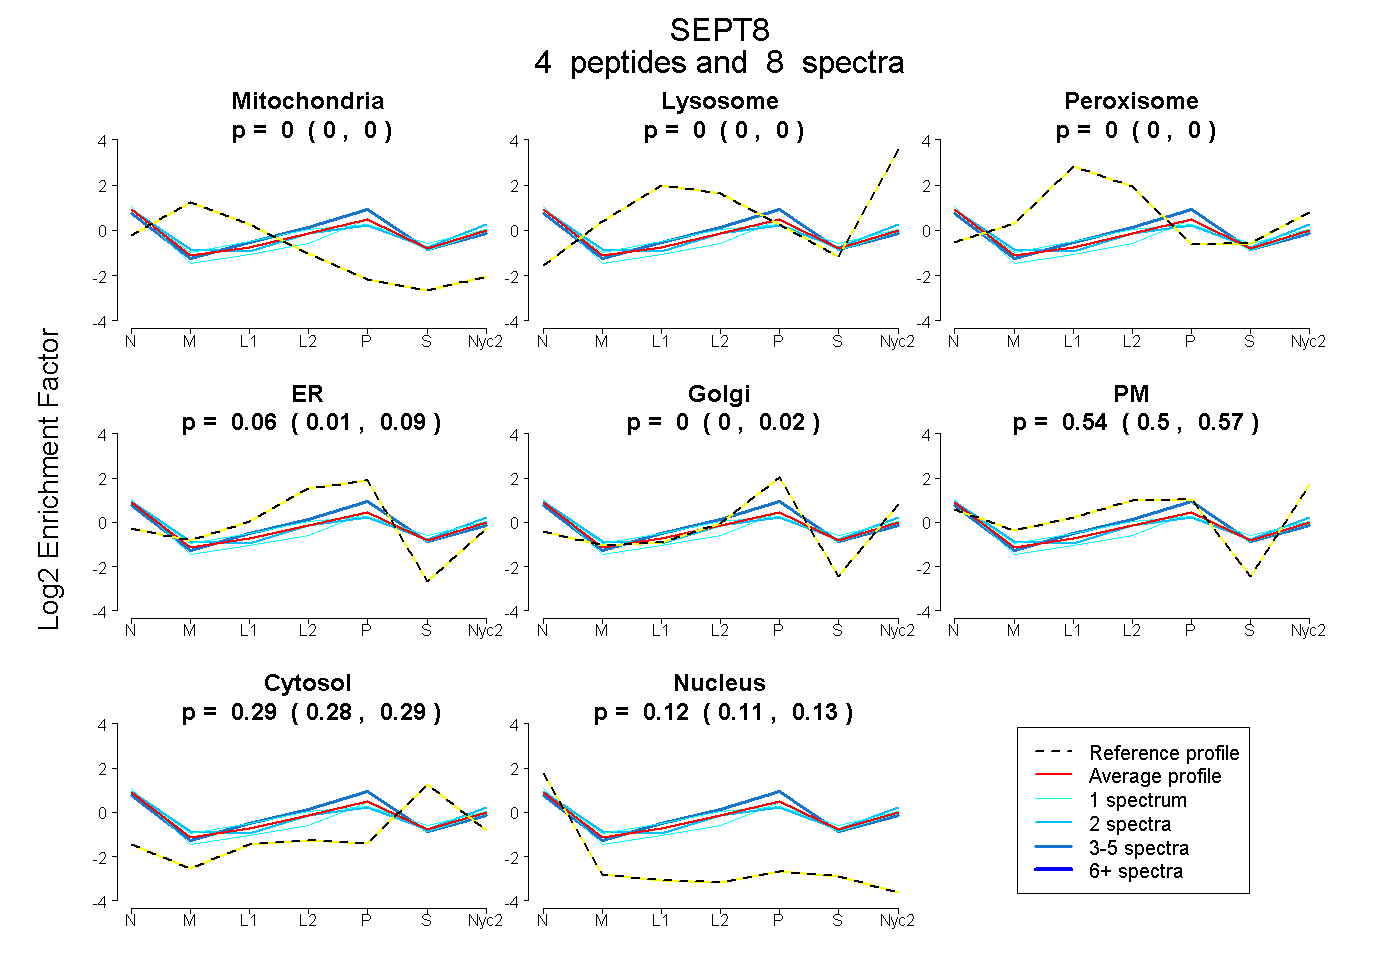
| Expt A |
4 peptides |
8 spectra |
|
0.000 0.000 | 0.000 |
0.000 0.000 | 0.000 |
0.000 0.000 | 0.000 |
0.057 0.014 | 0.089 |
0.000 0.000 | 0.022 |
0.539 0.504 | 0.565 |
0.286 0.275 | 0.294 |
0.118 0.106 | 0.127 |
| 2 spectra, ISNAEPEPR | 0.000 | 0.000 | 0.000 | 0.000 | 0.000 | 0.596 | 0.286 | 0.117 | ||
| 1 spectrum, ELEEETNAFNCR | 0.000 | 0.000 | 0.000 | 0.000 | 0.121 | 0.447 | 0.259 | 0.173 | ||
| 1 spectrum, LRPQTYDLQESNVHLK | 0.000 | 0.000 | 0.070 | 0.008 | 0.000 | 0.525 | 0.292 | 0.105 | ||
| 4 spectra, ADTISK | 0.000 | 0.000 | 0.000 | 0.270 | 0.000 | 0.381 | 0.275 | 0.075 |
| Plot | Mito | Lyso or Perox | ER | Golgi | PM | Cytosol | Nucleus | ||||||
| Expt B |
1 peptide |
1 spectrum |
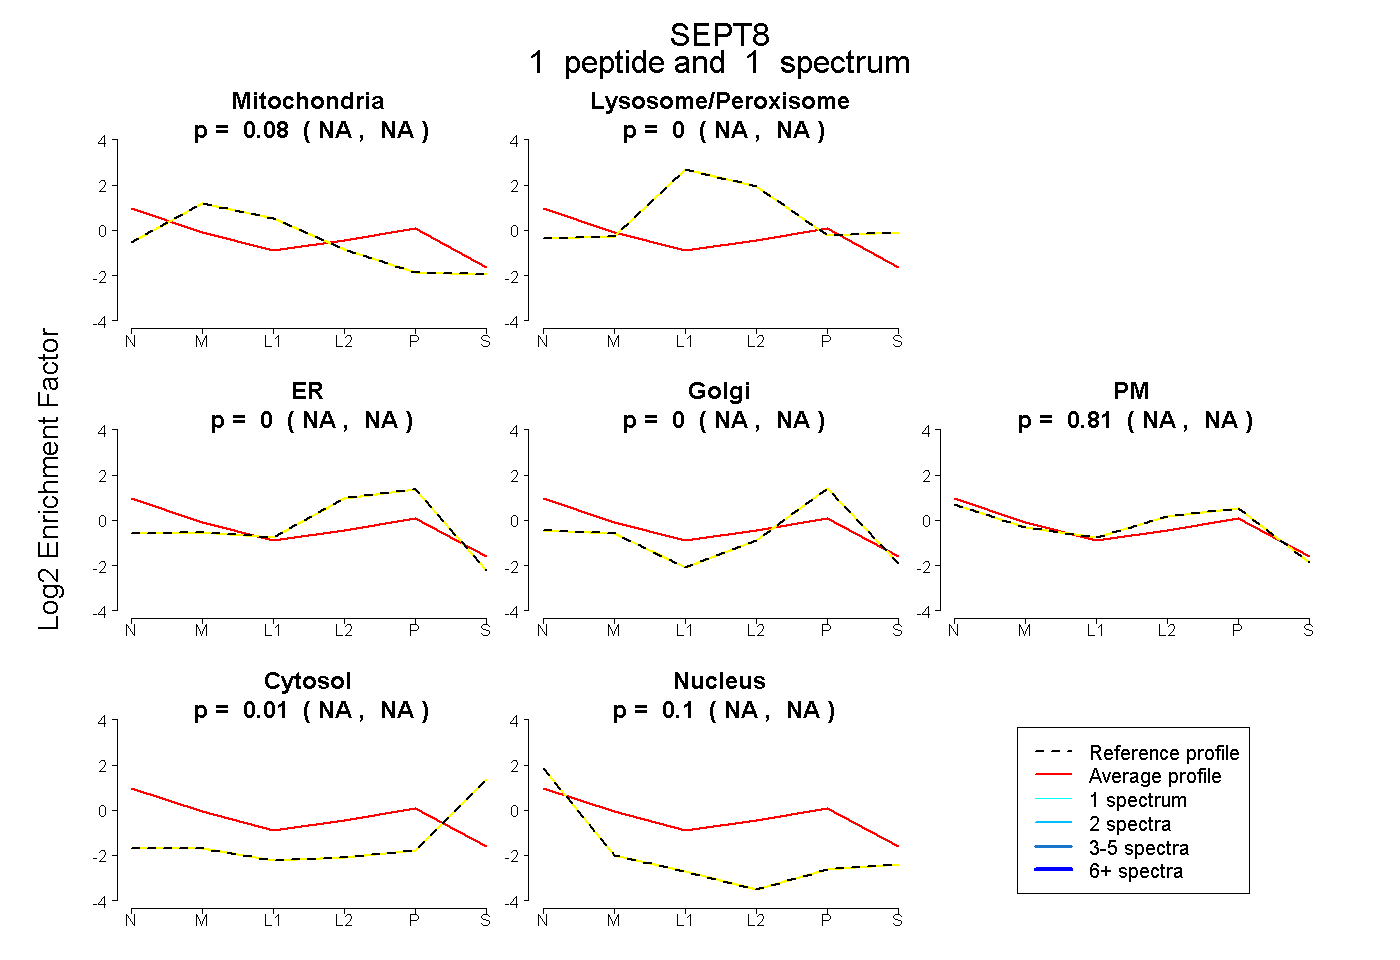 |
0.084 NA | NA |
0.000 NA | NA |
0.000 NA | NA |
0.000 NA | NA |
0.807 NA | NA |
0.013 NA | NA |
0.095 NA | NA |
|||
| Plot | Lyso | Other | |||||||||||
| Expt C |
4 peptides |
7 spectra |
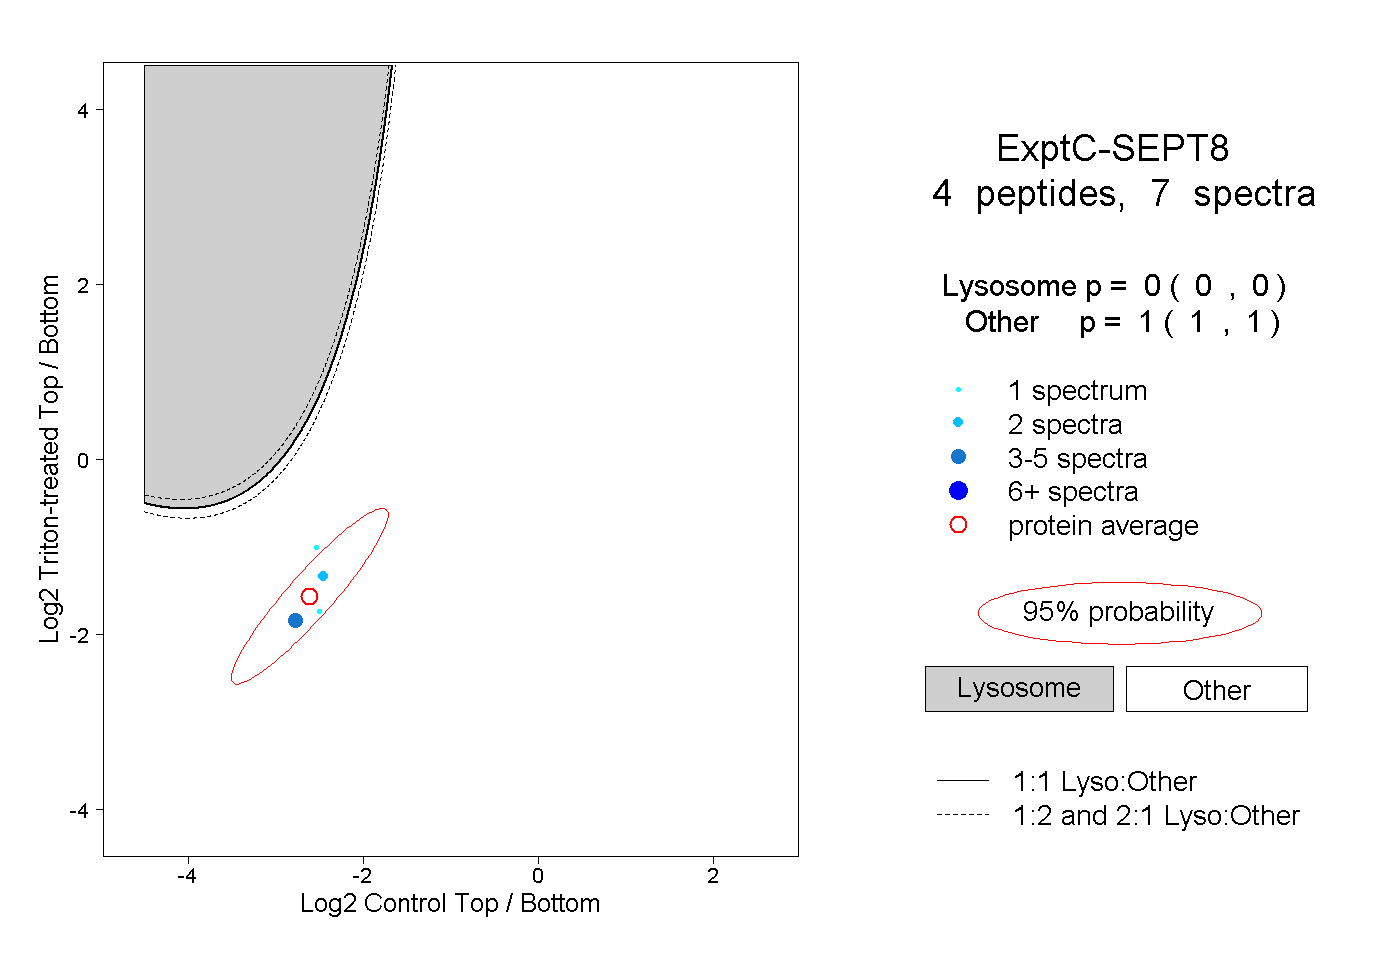 |
0.000 0.000 | 0.000 |
1.000 1.000 | 1.000 |
||||||||
| Plot | Lyso | Other | |||||||||||
| Expt D |
1 peptide |
2 spectra |
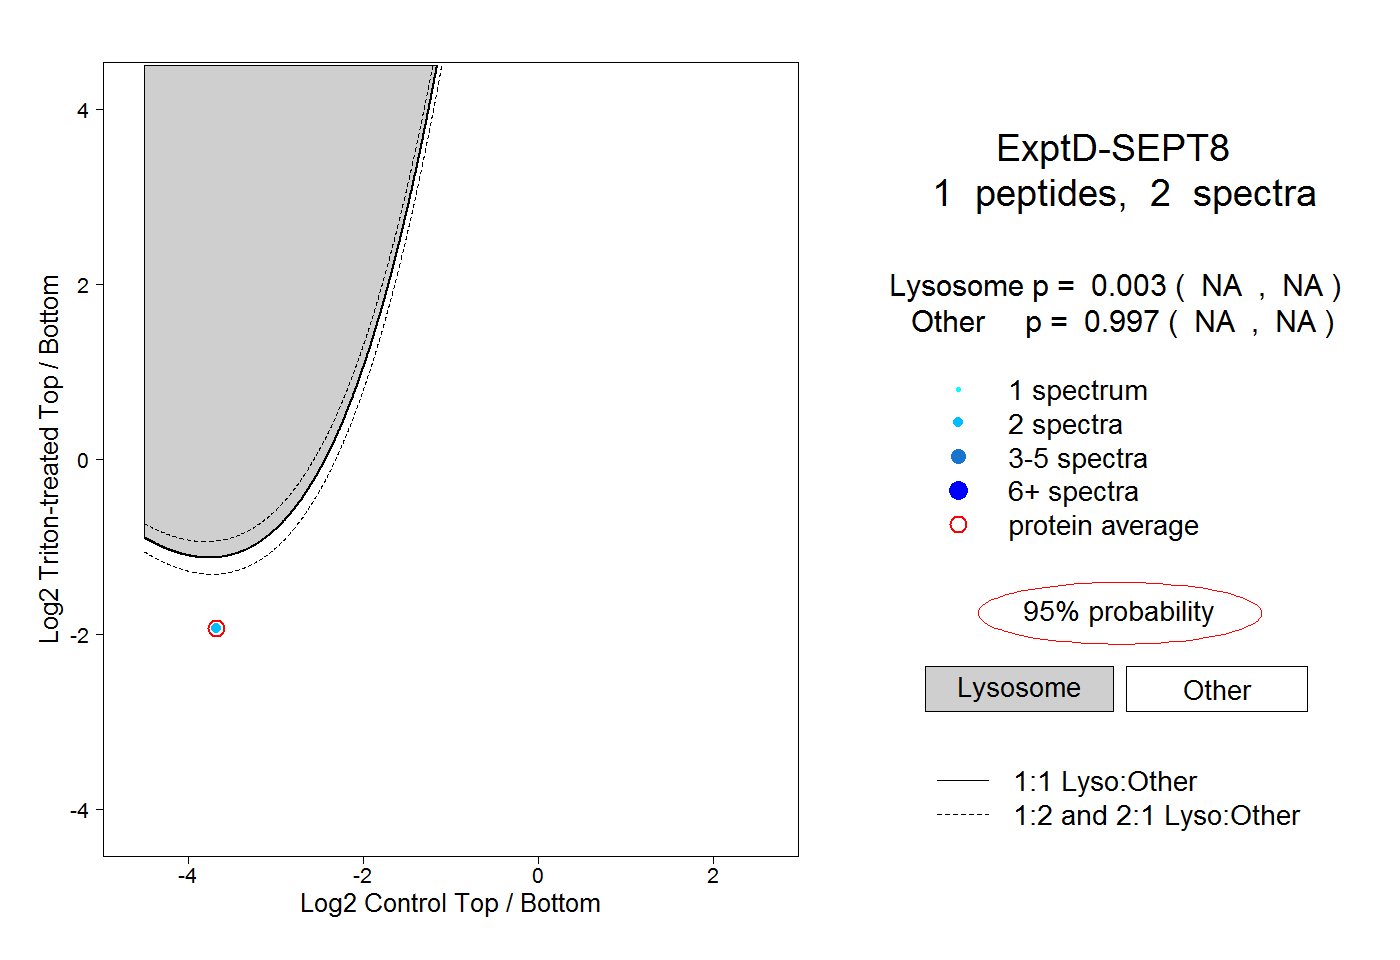 |
0.003 NA | NA |
0.997 NA | NA |