 6
6peptides
spectra
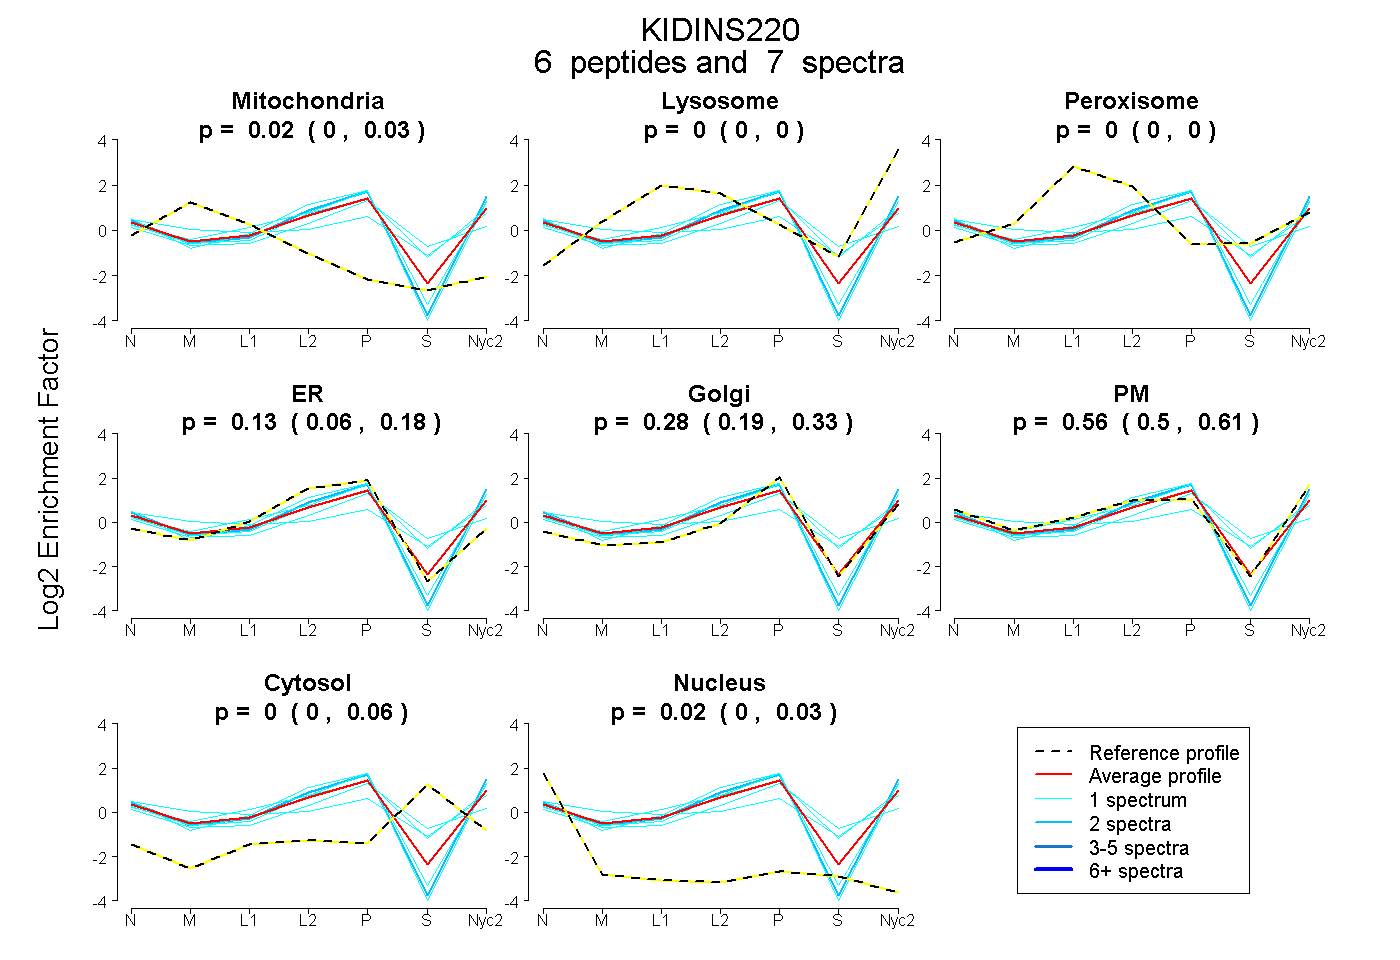
0.000 | 0.032
0.000 | 0.000
0.000 | 0.005
0.059 | 0.185
0.194 | 0.328
0.498 | 0.610
0.000 | 0.063
0.000 | 0.030
4peptides
spectra
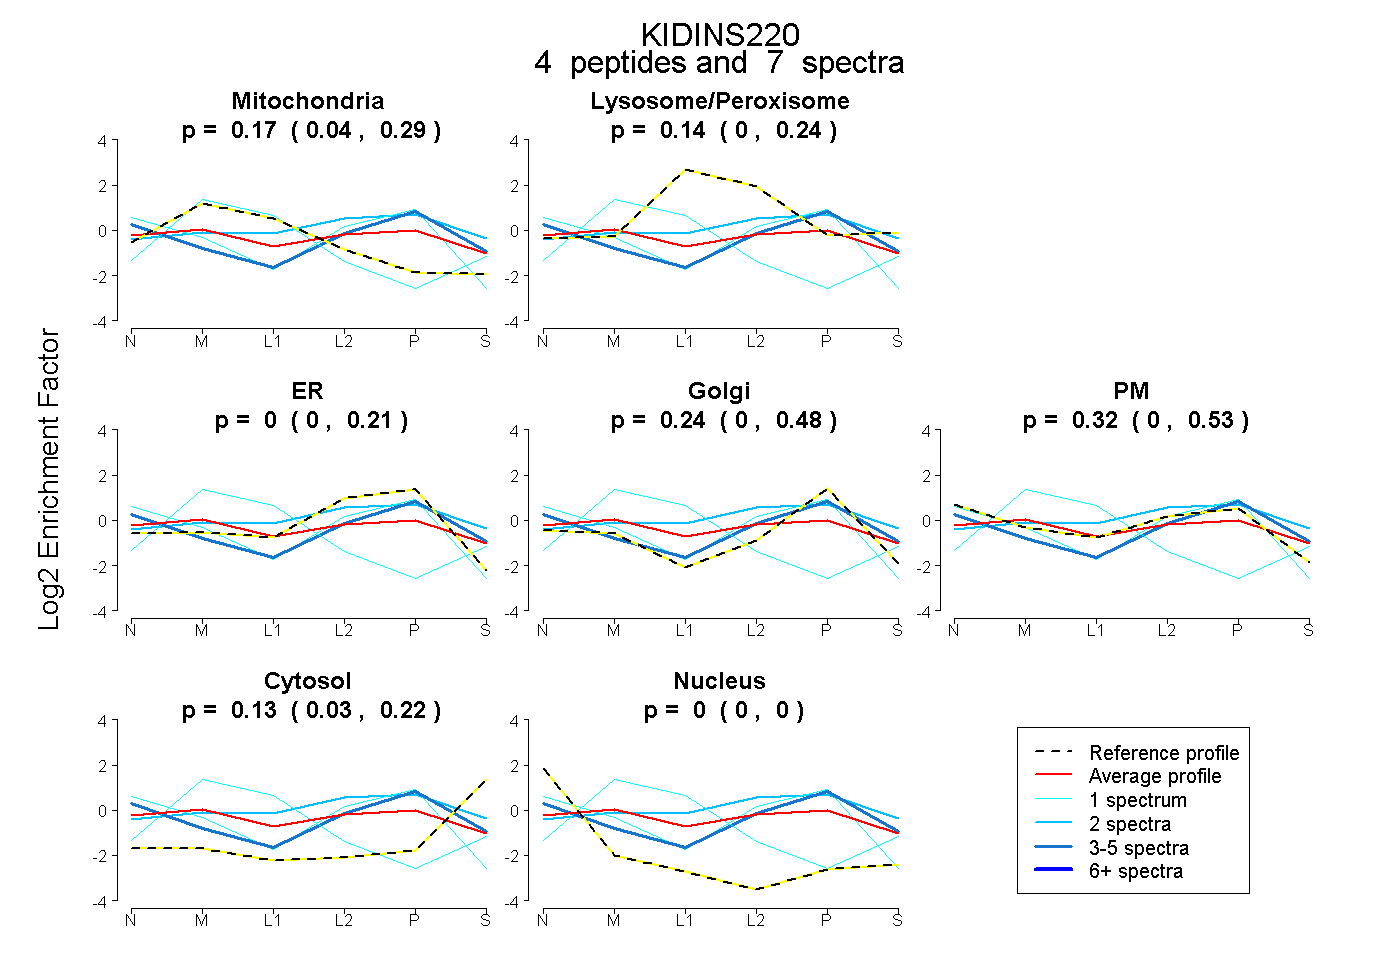
0.042 | 0.287
0.000 | 0.236
0.000 | 0.208
0.000 | 0.477
0.000 | 0.535
0.028 | 0.216
0.000 | 0.000
7peptides
spectra
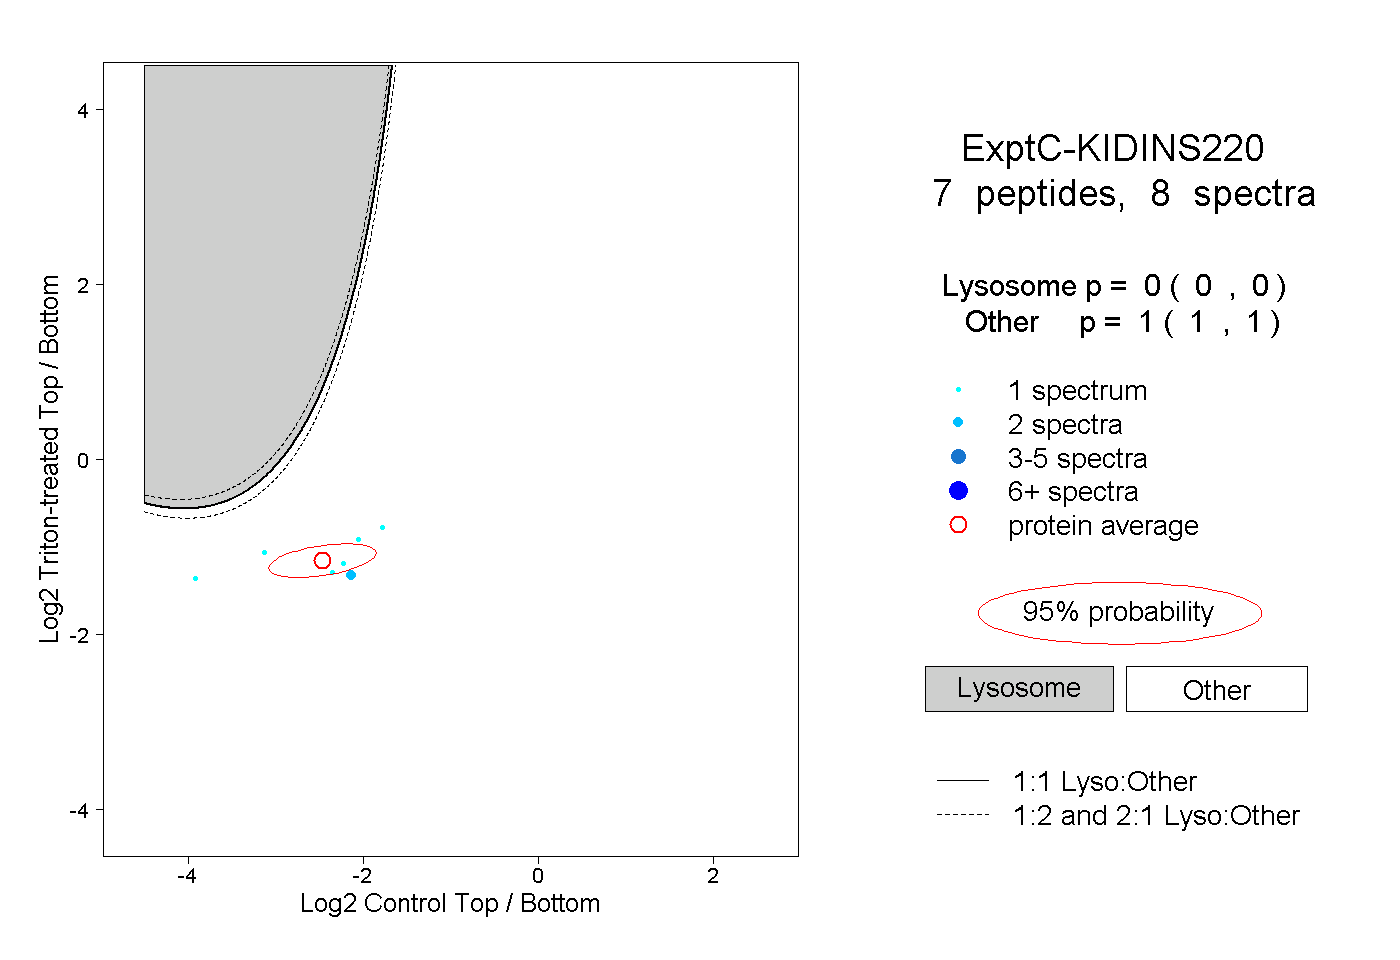
0.000 | 0.000
1.000 | 1.000
1peptide
spectrum
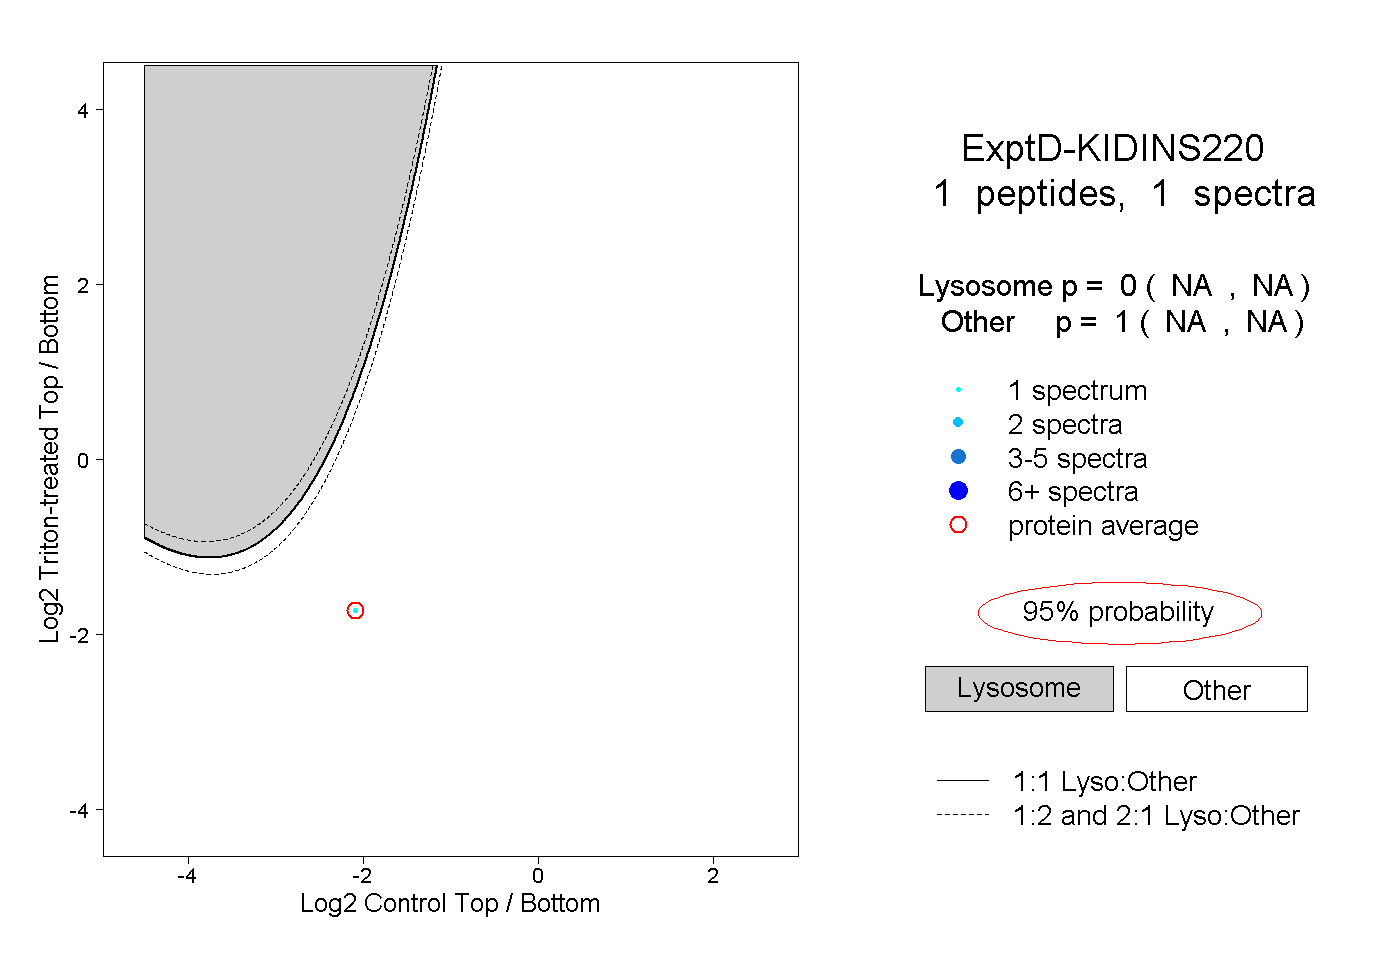
NA | NA
NA | NA