 6
6peptides
spectra
0.000 | 0.000
0.000 | 0.000
0.000 | 0.000
0.000 | 0.000
0.000 | 0.032
0.008 | 0.062
0.786 | 0.836
0.124 | 0.152
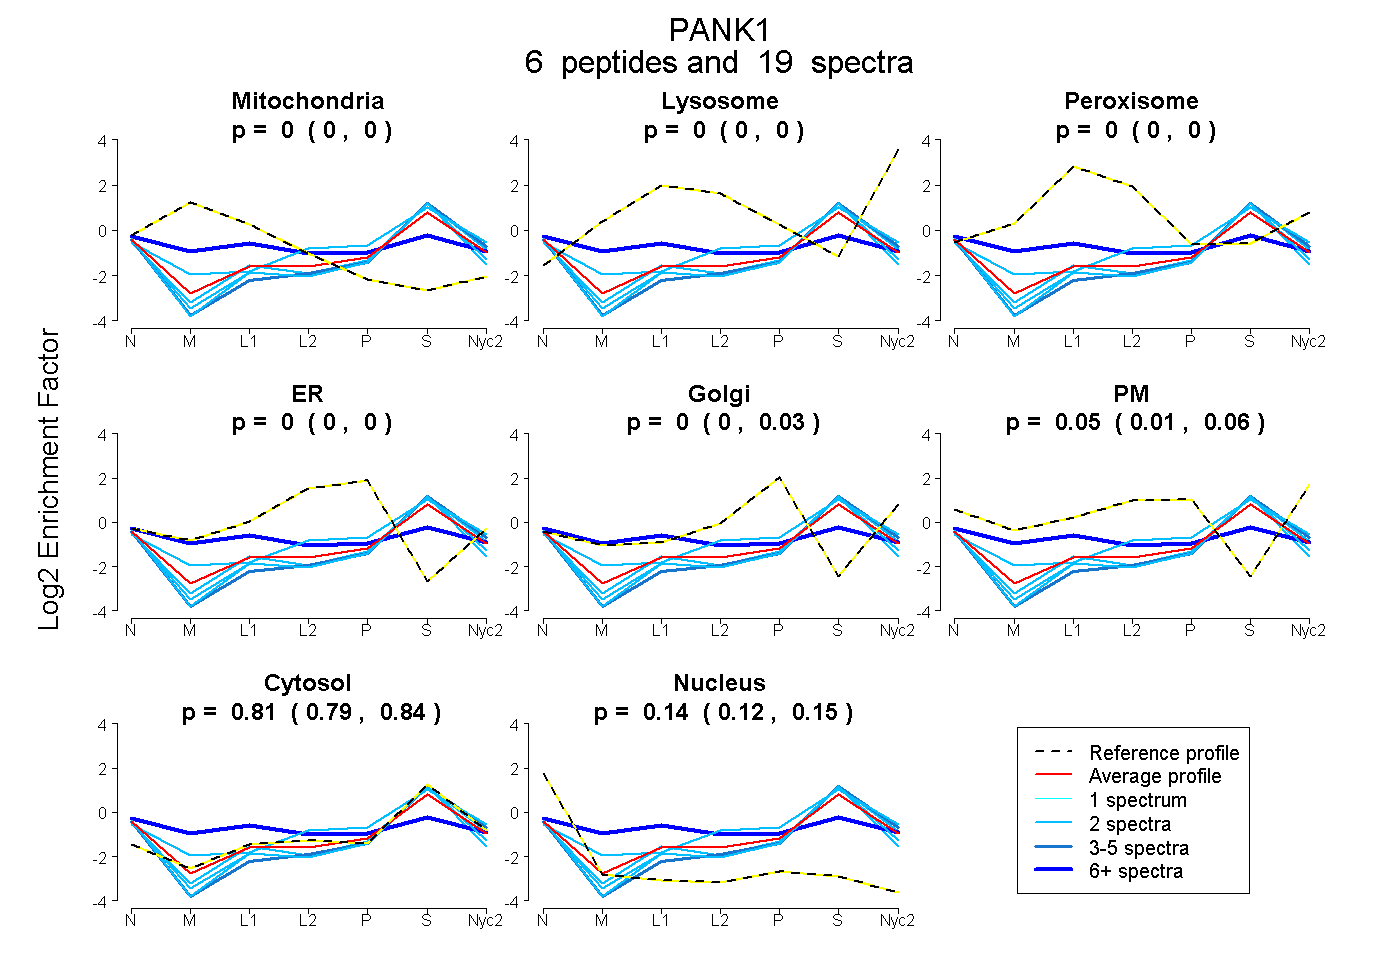
| Plot | Mito | Lyso | Perox | ER | Golgi | PM | Cytosol | Nucleus | |||||
| Expt A |
6 peptides |
19 spectra |
|
0.000 0.000 | 0.000 |
0.000 0.000 | 0.000 |
0.000 0.000 | 0.000 |
0.000 0.000 | 0.000 |
0.000 0.000 | 0.032 |
0.047 0.008 | 0.062 |
0.814 0.786 | 0.836 |
0.139 0.124 | 0.152 |
| 2 spectra, DIYGGDYER | 0.000 | 0.000 | 0.000 | 0.000 | 0.000 | 0.000 | 0.847 | 0.153 | ||
| 2 spectra, VVFVGNFLR | 0.000 | 0.000 | 0.000 | 0.000 | 0.000 | 0.000 | 0.828 | 0.172 | ||
| 2 spectra, MIADLQLHK | 0.000 | 0.000 | 0.000 | 0.000 | 0.060 | 0.107 | 0.813 | 0.019 | ||
| 2 spectra, DVHLELK | 0.000 | 0.000 | 0.000 | 0.000 | 0.000 | 0.000 | 0.866 | 0.134 | ||
| 7 spectra, GNLHFIR | 0.235 | 0.000 | 0.057 | 0.000 | 0.012 | 0.135 | 0.504 | 0.056 | ||
| 4 spectra, FEEDFR | 0.000 | 0.000 | 0.000 | 0.000 | 0.000 | 0.000 | 0.859 | 0.141 |
| Plot | Mito | Lyso or Perox | ER | Golgi | PM | Cytosol | Nucleus | ||||||
| Expt B |
2 peptides |
2 spectra |
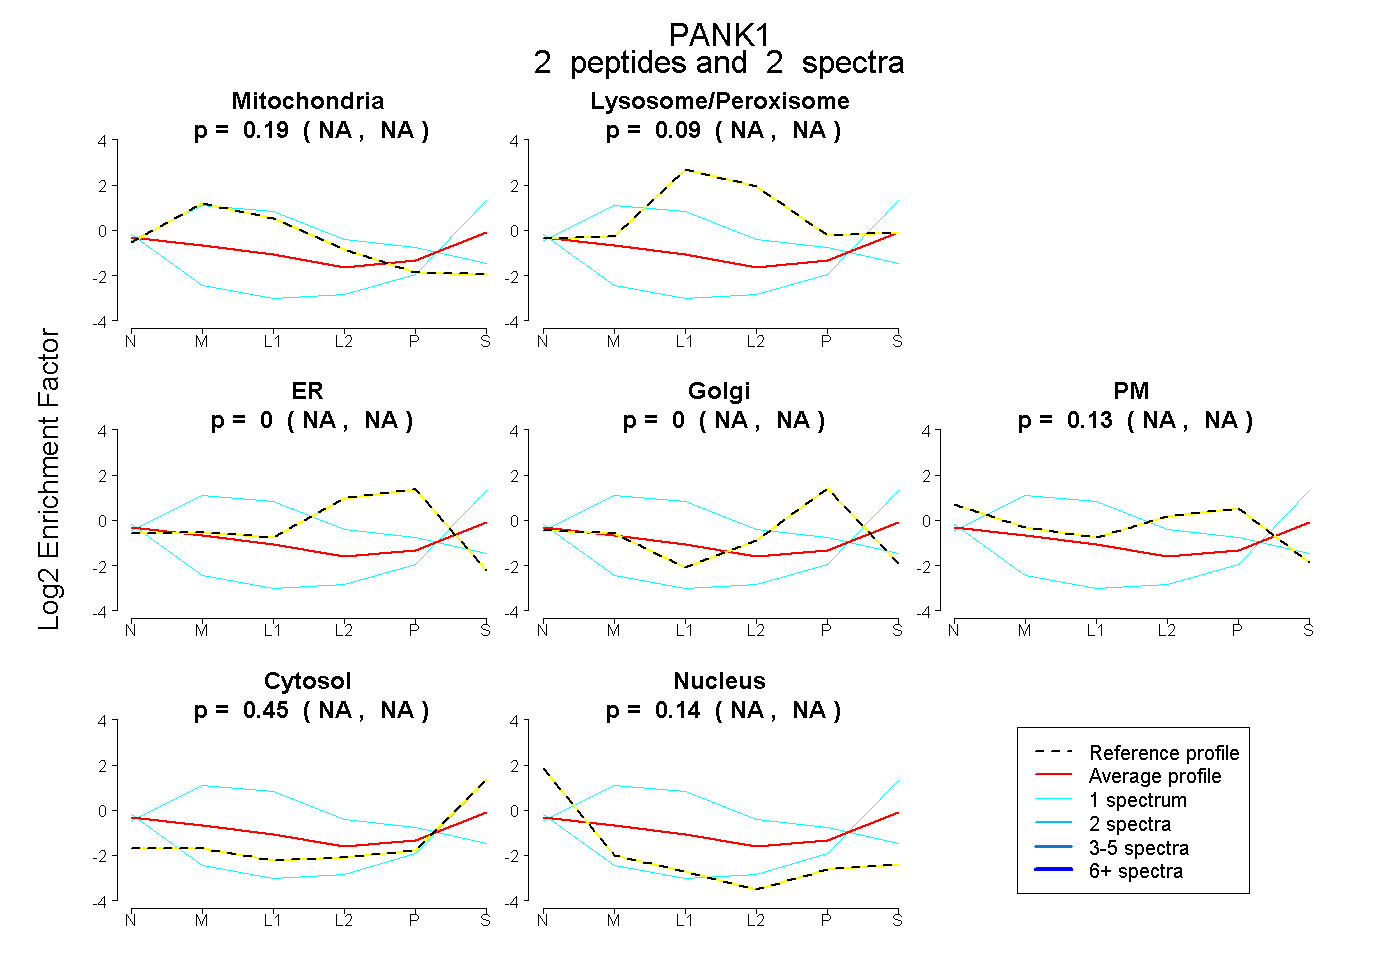 |
0.186 NA | NA |
0.089 NA | NA |
0.000 NA | NA |
0.000 NA | NA |
0.126 NA | NA |
0.455 NA | NA |
0.145 NA | NA |
|||
| Plot | Lyso | Other | |||||||||||
| Expt C |
7 peptides |
19 spectra |
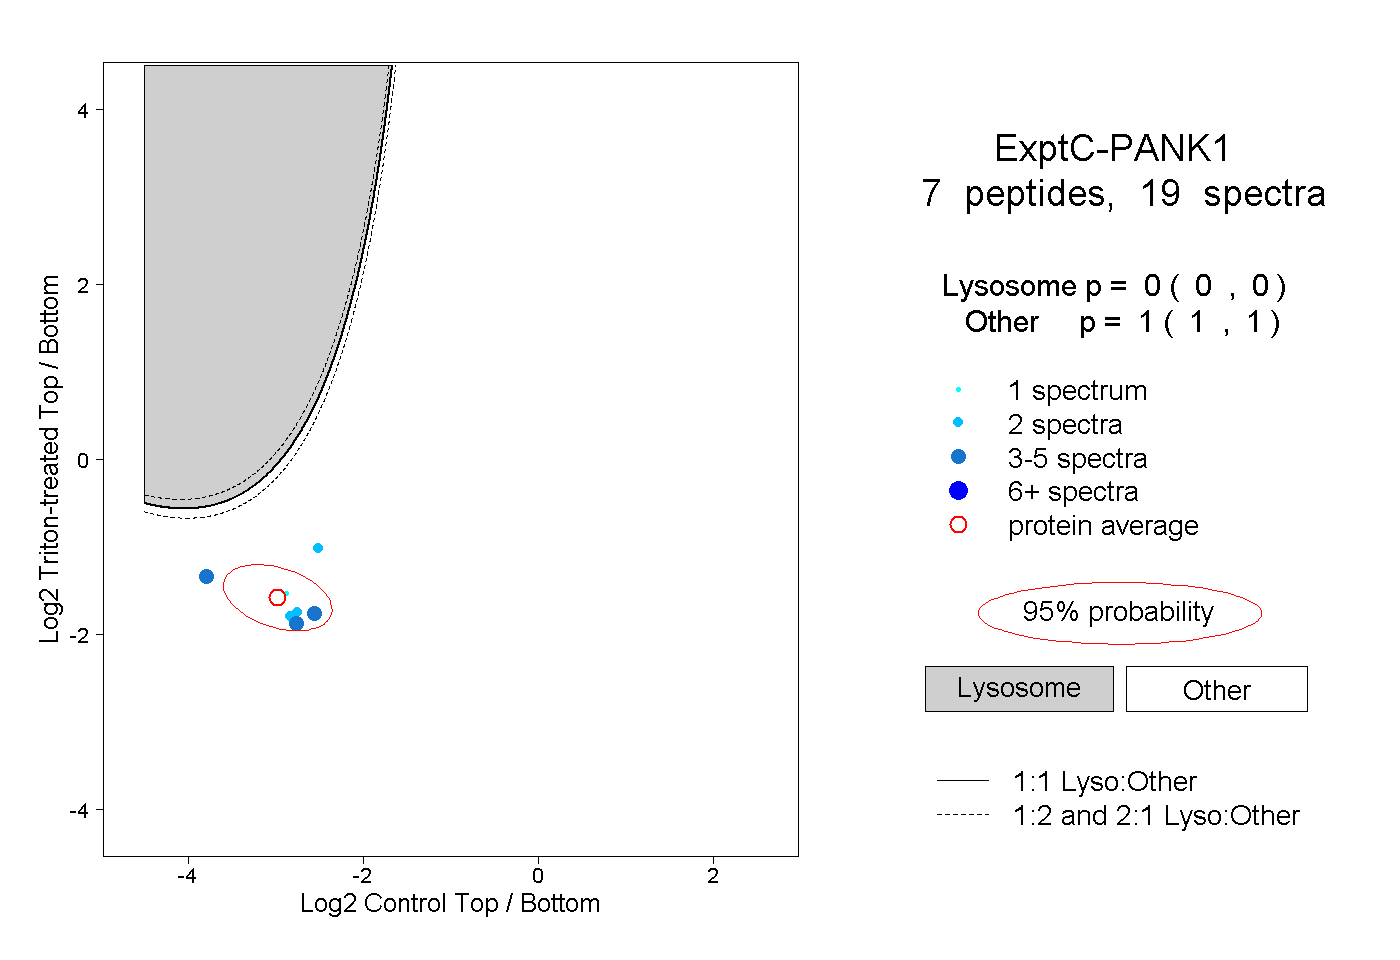 |
0.000 0.000 | 0.000 |
1.000 1.000 | 1.000 |
||||||||
| Plot | Lyso | Other | |||||||||||
| Expt D |
1 peptide |
27 spectra |
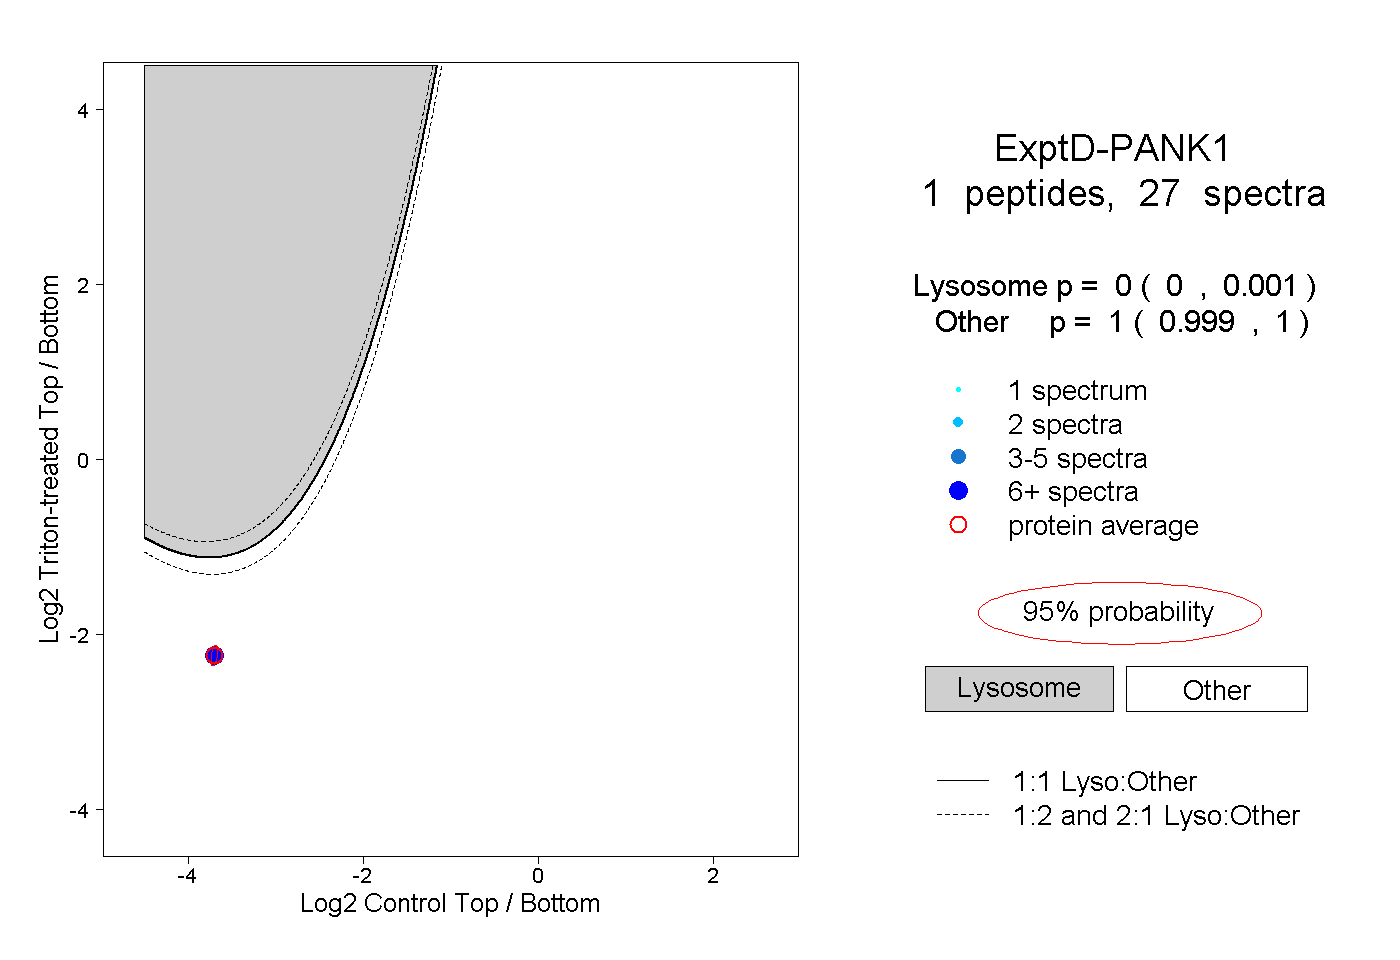 |
0.000 0.000 | 0.001 |
1.000 0.999 | 1.000 |