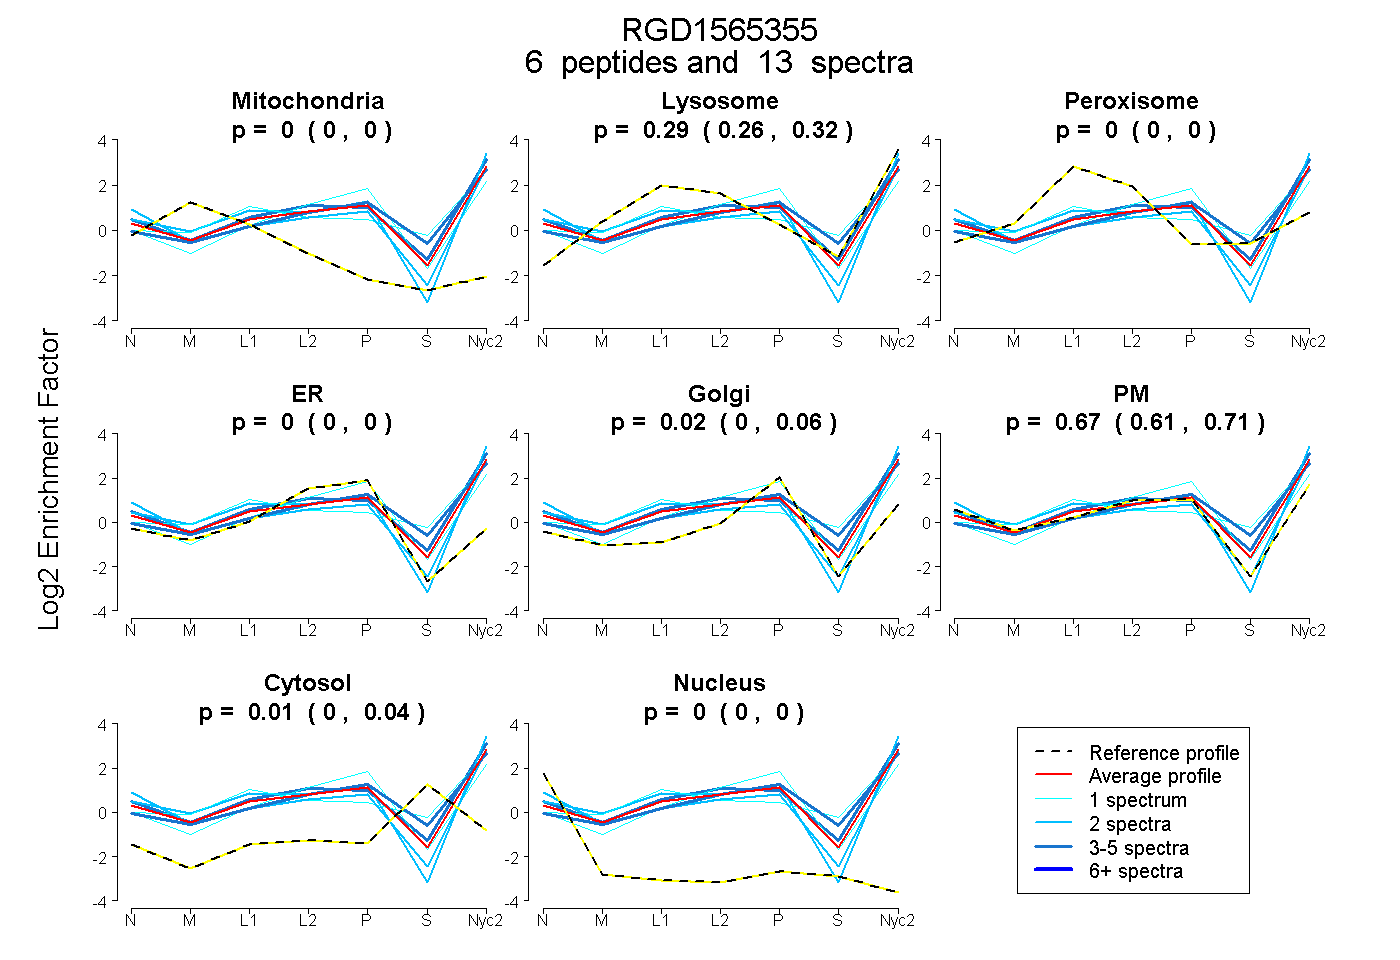
 6
6peptides
spectra
0.000 | 0.000
0.263 | 0.320
0.000 | 0.000
0.000 | 0.000
0.000 | 0.056
0.612 | 0.713
0.000 | 0.037
0.000 | 0.000
| Plot | Mito | Lyso | Perox | ER | Golgi | PM | Cytosol | Nucleus | |||||
| Expt A |
6 peptides |
13 spectra |
|
0.000 0.000 | 0.000 |
0.293 0.263 | 0.320 |
0.000 0.000 | 0.000 |
0.000 0.000 | 0.000 |
0.020 0.000 | 0.056 |
0.673 0.612 | 0.713 |
0.015 0.000 | 0.037 |
0.000 0.000 | 0.000 |
| 2 spectra, SSMFQTR | 0.000 | 0.078 | 0.000 | 0.000 | 0.000 | 0.922 | 0.000 | 0.000 | ||
| 1 spectrum, SIYAVFESEVNLK | 0.000 | 0.529 | 0.013 | 0.000 | 0.000 | 0.291 | 0.167 | 0.000 | ||
| 1 spectrum, LQVNILVKPAR | 0.000 | 0.231 | 0.000 | 0.000 | 0.370 | 0.399 | 0.000 | 0.000 | ||
| 2 spectra, GPYTYR | 0.000 | 0.244 | 0.000 | 0.000 | 0.000 | 0.756 | 0.000 | 0.000 | ||
| 3 spectra, EVVLEEGTIAFK | 0.000 | 0.358 | 0.000 | 0.000 | 0.000 | 0.636 | 0.007 | 0.000 | ||
| 4 spectra, TGTTVYR | 0.000 | 0.391 | 0.000 | 0.000 | 0.142 | 0.351 | 0.116 | 0.000 |
| Plot | Lyso | Other | |||||||||||
| Expt C |
1 peptide |
2 spectra |
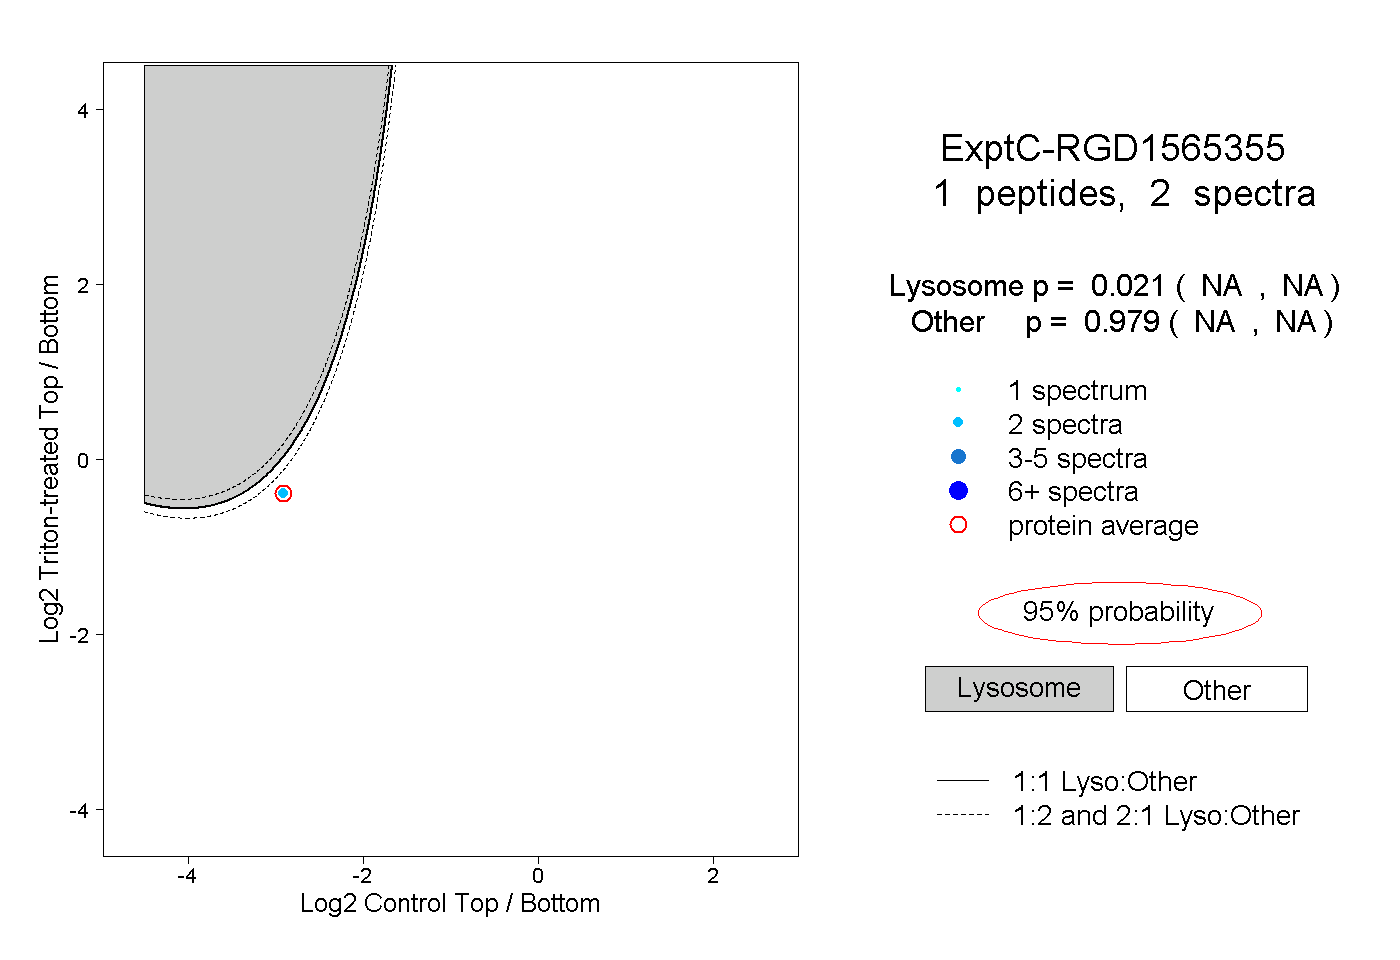 |
0.021 NA | NA |
0.979 NA | NA |